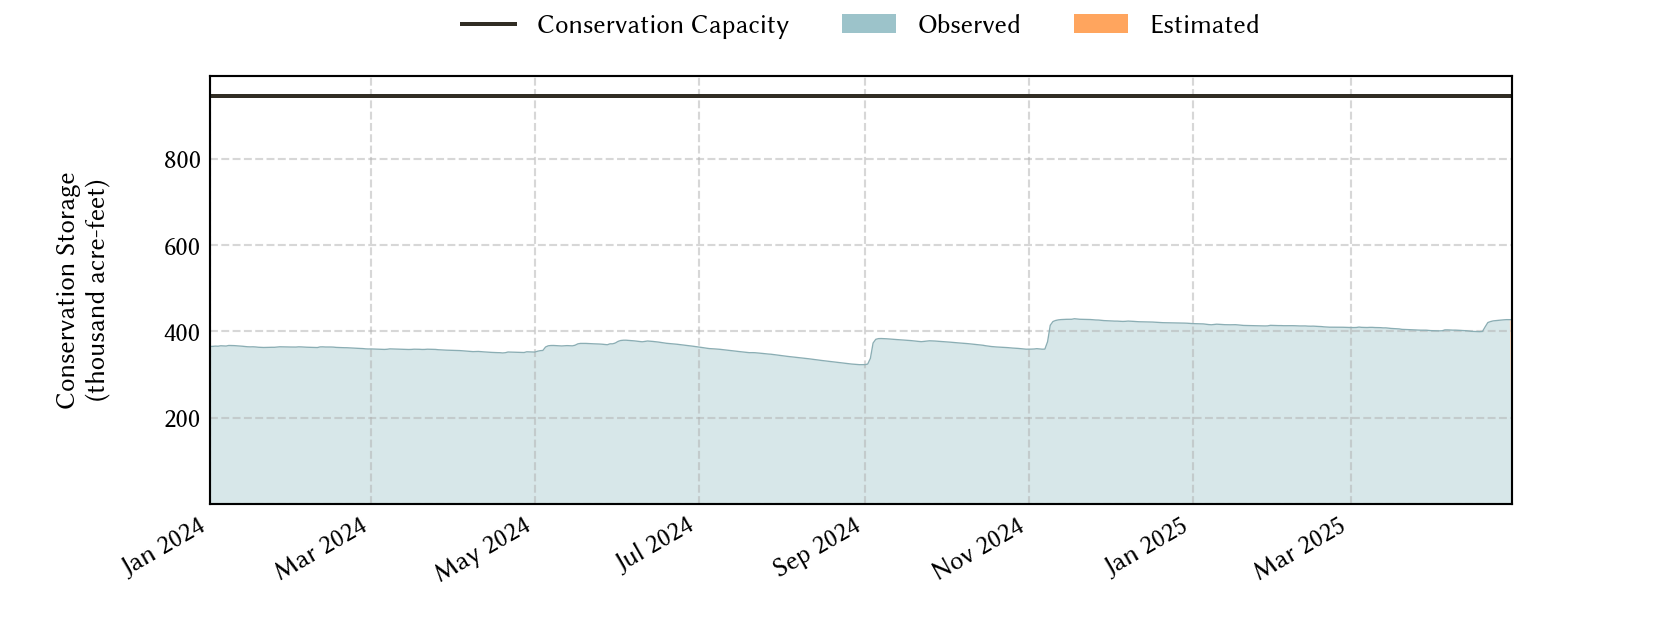
Abilene Area Reservoirs: Monitored Water Supply Reservoirs are 37.2% full on 2024-04-24
Historical Data
| Date | Percent Full |
Reservoir Storage (acre-ft) |
Conservation Storage (acre-ft) |
Conservation Capacity (acre-ft) |
|
|---|---|---|---|---|---|
| Today | 2024-04-24 | 37.2 | 356,275 | 351,393 | 945,568 |
| Yesterday | 2024-04-23 | 37.2 | 356,577 | 351,695 | 945,568 |
| 2 days ago | 2024-04-22 | 37.2 | 356,923 | 352,041 | 945,568 |
| 1 week ago | 2024-04-17 | 37.1 | 355,693 | 350,811 | 945,568 |
| 1 month ago | 2024-03-24 | 37.9 | 363,461 | 358,579 | 945,568 |
| 3 months ago | 2024-01-24 | 38.4 | 368,076 | 363,194 | 945,568 |
| 6 months ago | 2023-10-24 | 39.7 | 380,171 | 375,289 | 945,568 |
| 1 year ago | 2023-04-24 | 47.7 | 455,694 | 450,812 | 945,568 |
*
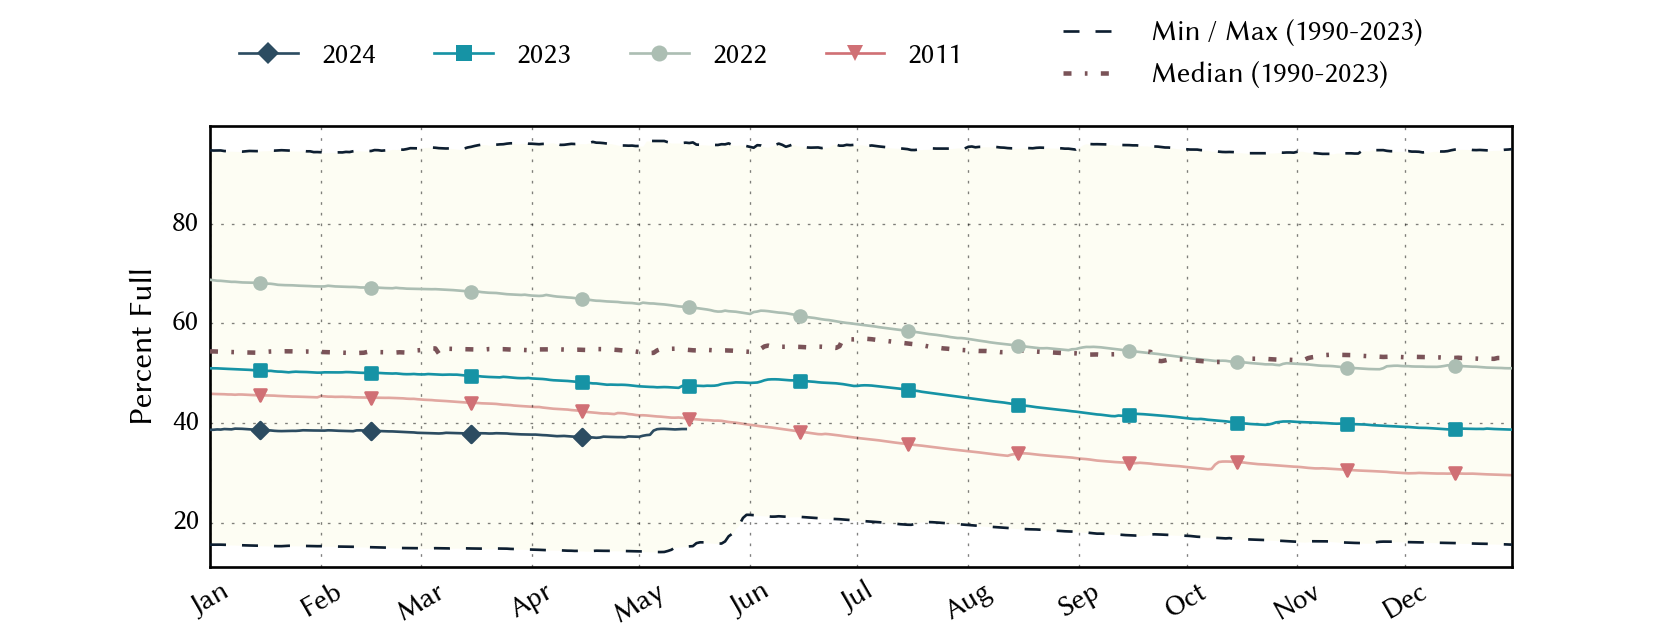
Percent Full is based on Conservation Storage and Conservation Capacity and doesn't account for storage in flood pool.
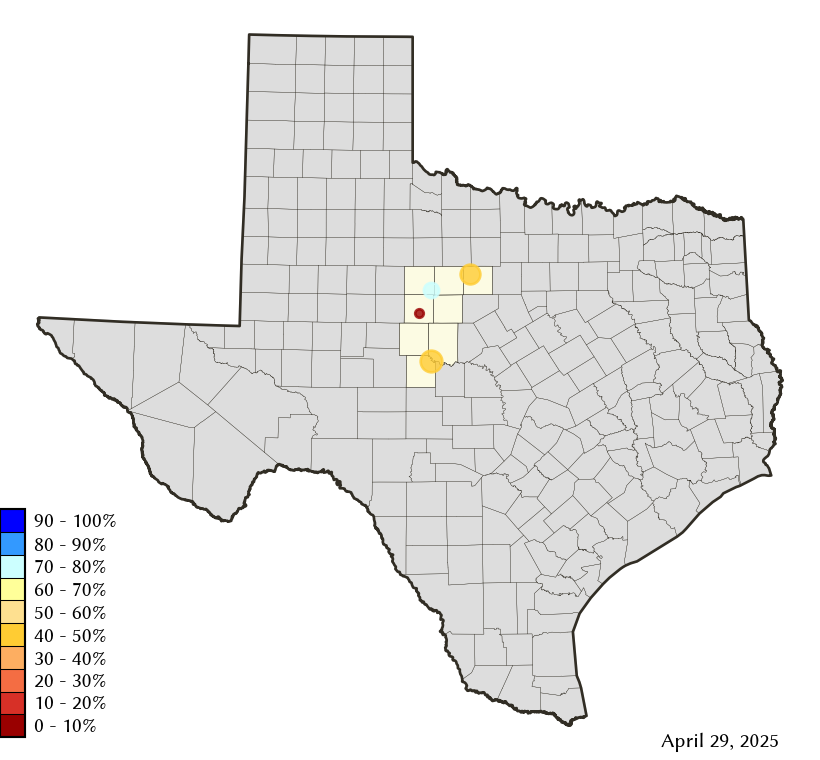
Area Map
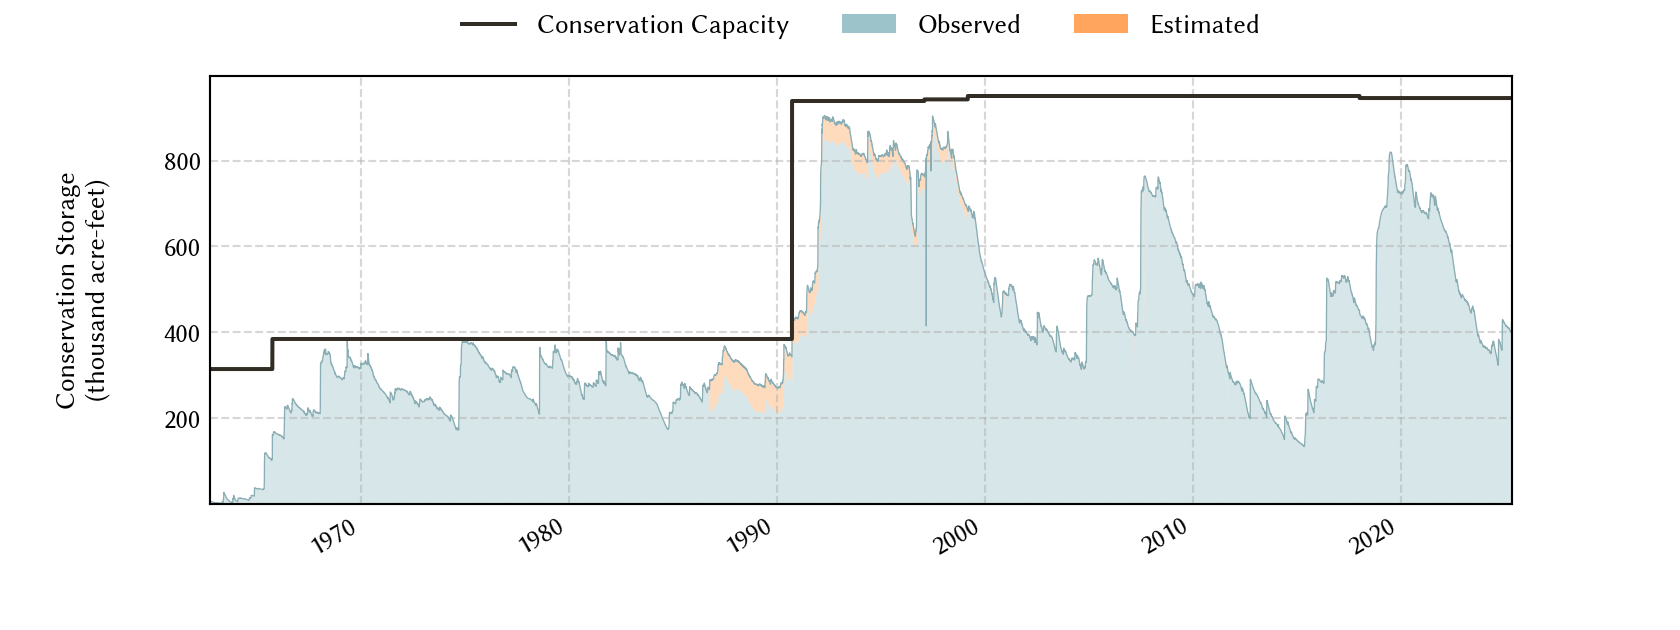
Reservoir Storage
| Reservoir | Percent Full |
Water Level (ft) |
Height Above Conservation Pool (ft) |
Reservoir Storage (acre-ft) |
Conservation Storage (acre-ft) |
Conservation Capacity (acre-ft) |
Surface Area (acres) |
|---|---|---|---|---|---|---|---|
| Abilene | 11.7 | 1,993.69 | -18.61 | 928 | 928 | 7,900 | 168 |
| Fort Phantom Hill | 66.6 | 1,629.04 | -6.86 | 46,661 | 46,655 | 70,030 | 2,973 |
| Hubbard Creek | 50.5 | 1,171.14 | -12.17 | 162,993 | 158,117 | 313,298 | 10,022 |
| O H Ivie | 26.3 | 1,519.77 | -31.73 | 145,693 | 145,693 | 554,340 | - n.a. - |