Austin Area Reservoirs: Monitored Water Supply Reservoirs are 44.5% full on 2024-04-18
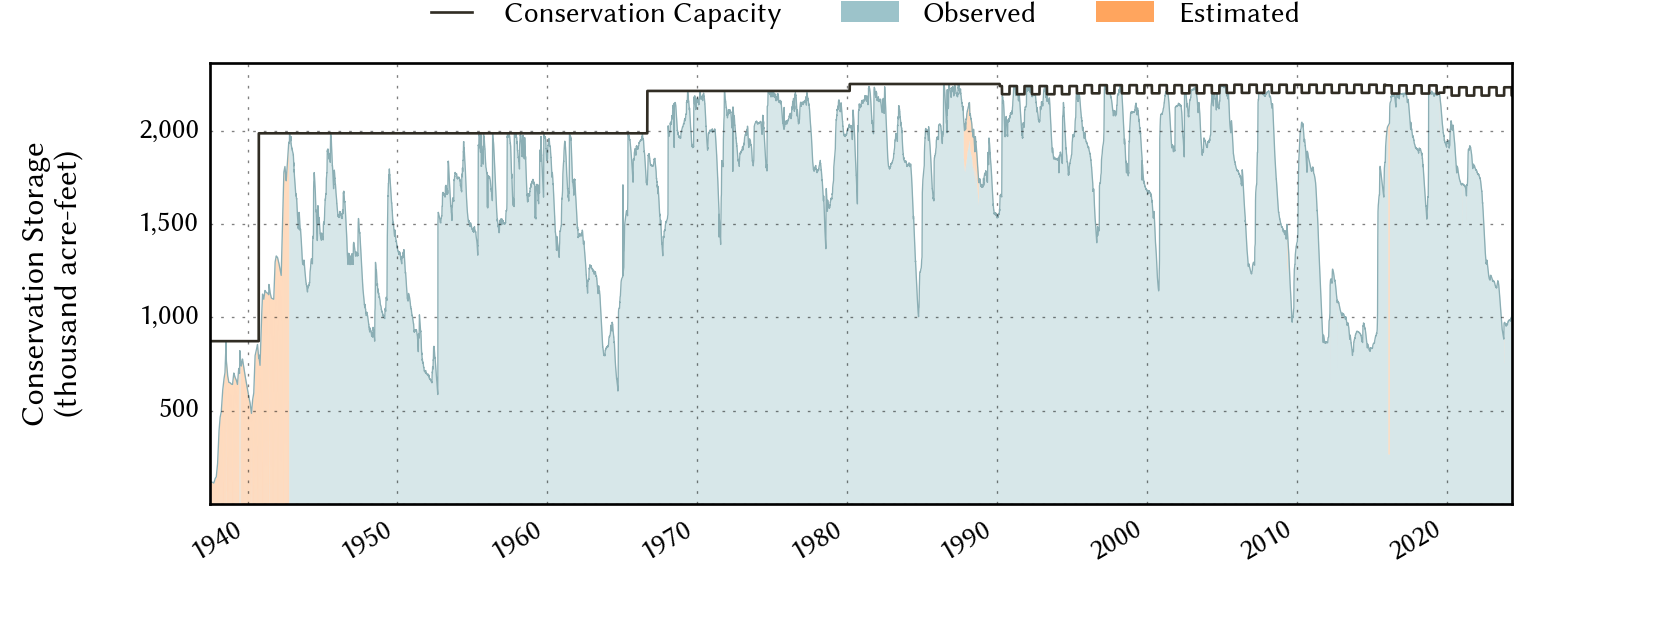
Historical Data
| Date | Percent Full |
Reservoir Storage (acre-ft) |
Conservation Storage (acre-ft) |
Conservation Capacity (acre-ft) |
|
|---|---|---|---|---|---|
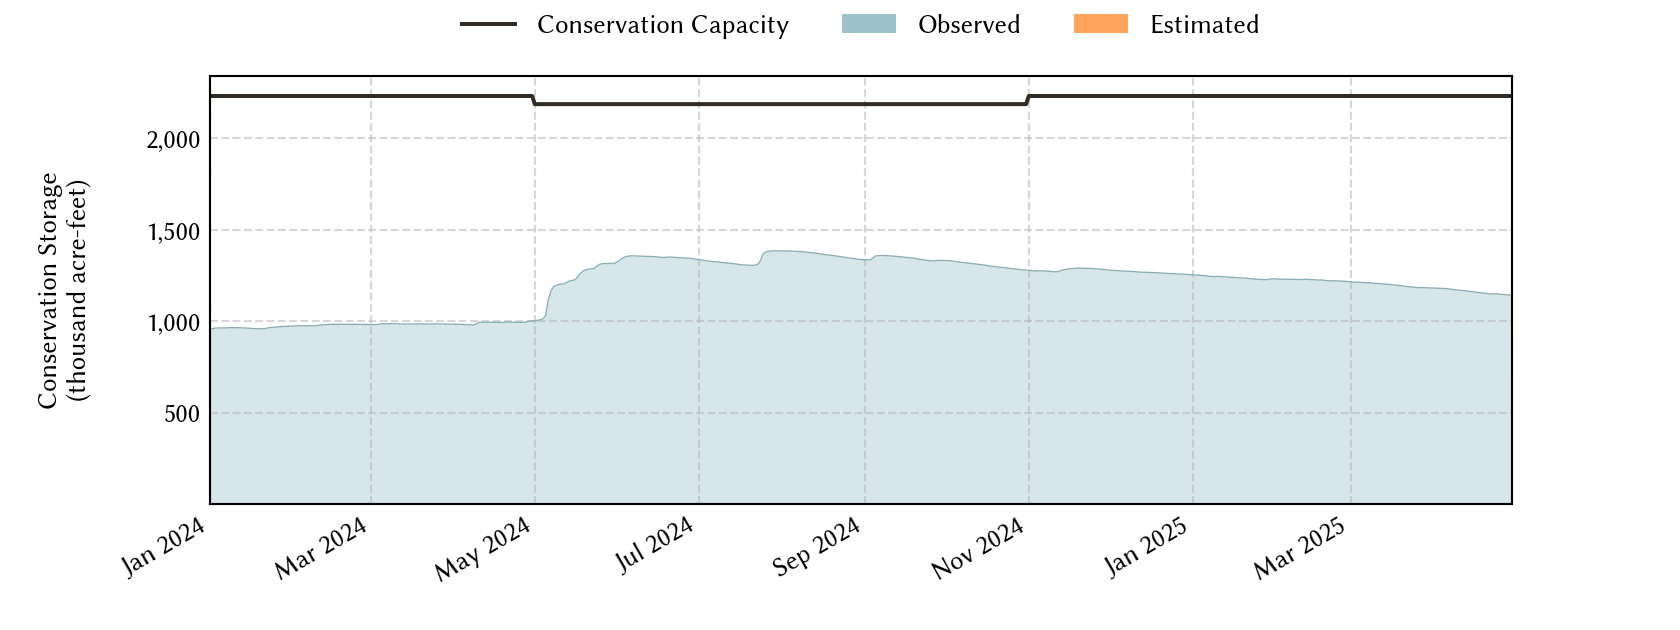
| Today | 2024-04-18 | 44.5 | 1,024,175 | 993,332 | 2,232,539 |
| Yesterday | 2024-04-17 | 44.5 | 1,024,582 | 993,739 | 2,232,539 |
| 2 days ago | 2024-04-16 | 44.5 | 1,025,013 | 994,170 | 2,232,539 |
| 1 week ago | 2024-04-11 | 44.6 | 1,025,608 | 994,765 | 2,232,539 |
| 1 month ago | 2024-03-18 | 44.2 | 1,016,744 | 985,901 | 2,232,539 |
| 3 months ago | 2024-01-18 | 43.0 | 990,348 | 959,505 | 2,232,539 |
| 6 months ago | 2023-10-18 | 40.7 | 921,474 | 890,631 | 2,188,052 |
| 1 year ago | 2023-04-18 | 52.0 | 1,190,837 | 1,159,994 | 2,232,539 |
*
Percent Full is based on Conservation Storage and Conservation Capacity and doesn't account for storage in flood pool.
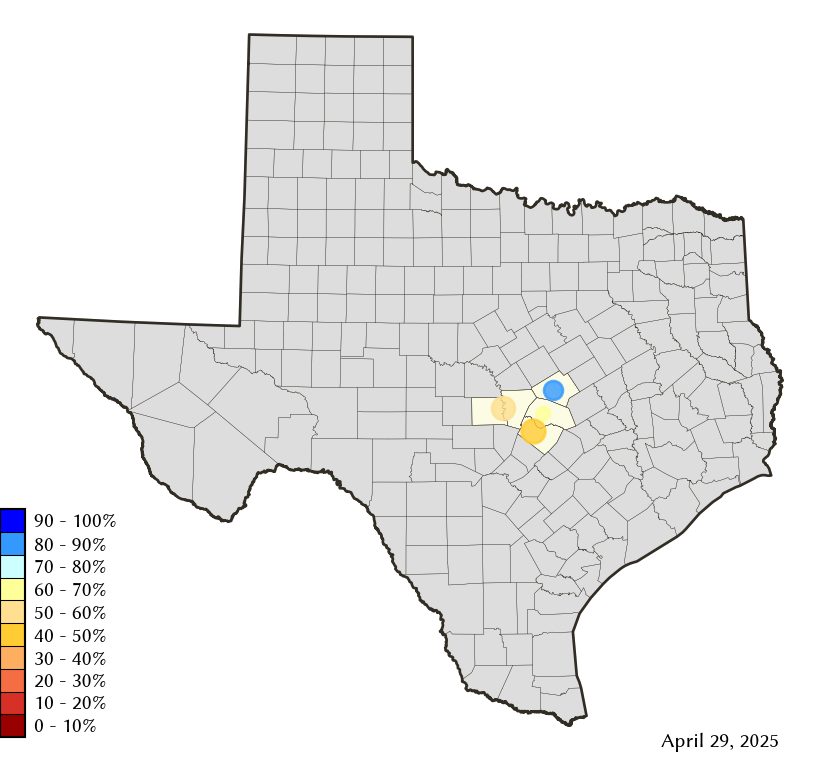
Area Map
Reservoir Storage
| Reservoir | Percent Full |
Water Level (ft) |
Height Above Conservation Pool (ft) |
Reservoir Storage (acre-ft) |
Conservation Storage (acre-ft) |
Conservation Capacity (acre-ft) |
Surface Area (acres) |
|---|---|---|---|---|---|---|---|
| Buchanan | 46.5 | 995.10 | -24.90 | 416,920 | 403,258 | 866,694 | 14,251 |
| Georgetown | 78.7 | 784.37 | -6.63 | 29,990 | 29,927 | 38,005 | 1,132 |
| Stillhouse Hollow | 65.4 | 607.40 | -14.60 | 150,327 | 150,241 | 229,796 | 4,554 |
| Travis | 37.3 | 630.59 | -50.41 | 426,938 | 409,906 | 1,098,044 | 9,260 |