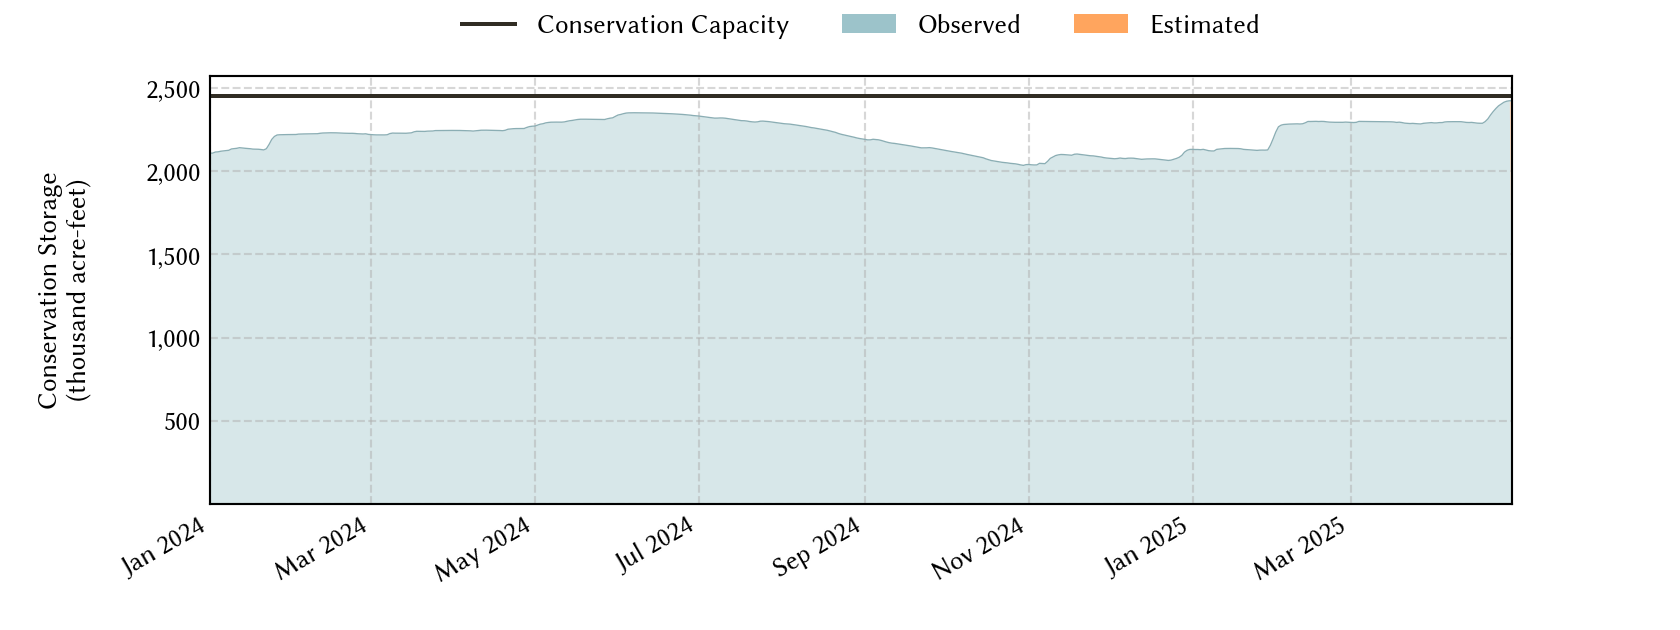
Fort Worth Area Reservoirs: Monitored Water Supply Reservoirs are 91.6% full on 2024-04-17
Historical Data
| Date | Percent Full |
Reservoir Storage (acre-ft) |
Conservation Storage (acre-ft) |
Conservation Capacity (acre-ft) |
|
|---|---|---|---|---|---|
| Today | 2024-04-17 | 91.6 | 2,296,199 | 2,244,921 | 2,451,597 |
| Yesterday | 2024-04-16 | 91.6 | 2,298,784 | 2,245,296 | 2,451,597 |
| 2 days ago | 2024-04-15 | 91.6 | 2,302,305 | 2,245,721 | 2,451,597 |
| 1 week ago | 2024-04-10 | 91.6 | 2,316,646 | 2,245,501 | 2,451,597 |
| 1 month ago | 2024-03-17 | 91.2 | 2,288,916 | 2,236,386 | 2,451,597 |
| 3 months ago | 2024-01-17 | 87.0 | 2,167,463 | 2,132,435 | 2,451,597 |
| 6 months ago | 2023-10-17 | 77.7 | 1,941,011 | 1,906,021 | 2,451,597 |
| 1 year ago | 2023-04-17 | 91.2 | 2,274,101 | 2,236,716 | 2,451,597 |
*
Percent Full is based on Conservation Storage and Conservation Capacity and doesn't account for storage in flood pool.
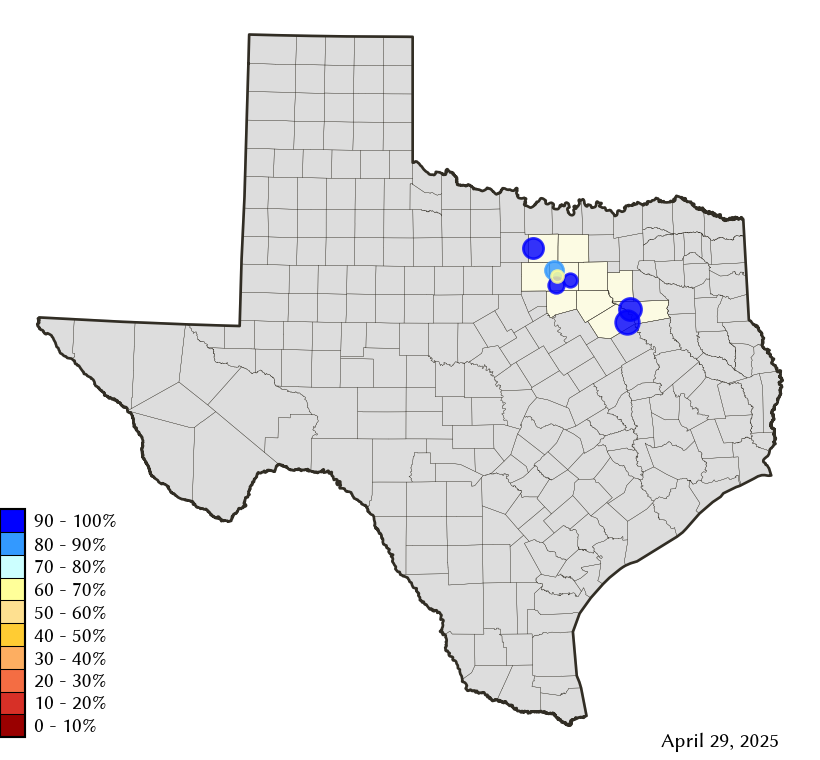
Area Map
Reservoir Storage
| Reservoir | Percent Full |
Water Level (ft) |
Height Above Conservation Pool (ft) |
Reservoir Storage (acre-ft) |
Conservation Storage (acre-ft) |
Conservation Capacity (acre-ft) |
Surface Area (acres) |
|---|---|---|---|---|---|---|---|
| Arlington | 99.2 | 549.83 | -0.17 | 39,862 | 39,830 | 40,157 | 1,919 |
| Benbrook | 97.5 | 693.41 | -0.59 | 83,495 | 83,495 | 85,648 | 3,576 |
| Bridgeport | 57.8 | 821.19 | -14.81 | 215,063 | 215,063 | 372,183 | 8,992 |
| Cedar Creek | 100.0 | 322.00 | 0.00 | 644,785 | 644,686 | 644,686 | 32,873 |
| Eagle Mountain | 80.0 | 644.78 | -4.32 | 147,995 | 147,995 | 185,087 | 8,013 |
| Richland-Chambers | 100.0 | 315.37 | 0.37 | 1,141,488 | 1,099,417 | 1,099,417 | - n.a. - |
| Worth | 59.1 | 590.91 | -3.09 | 23,511 | 14,435 | 24,419 | 2,963 |