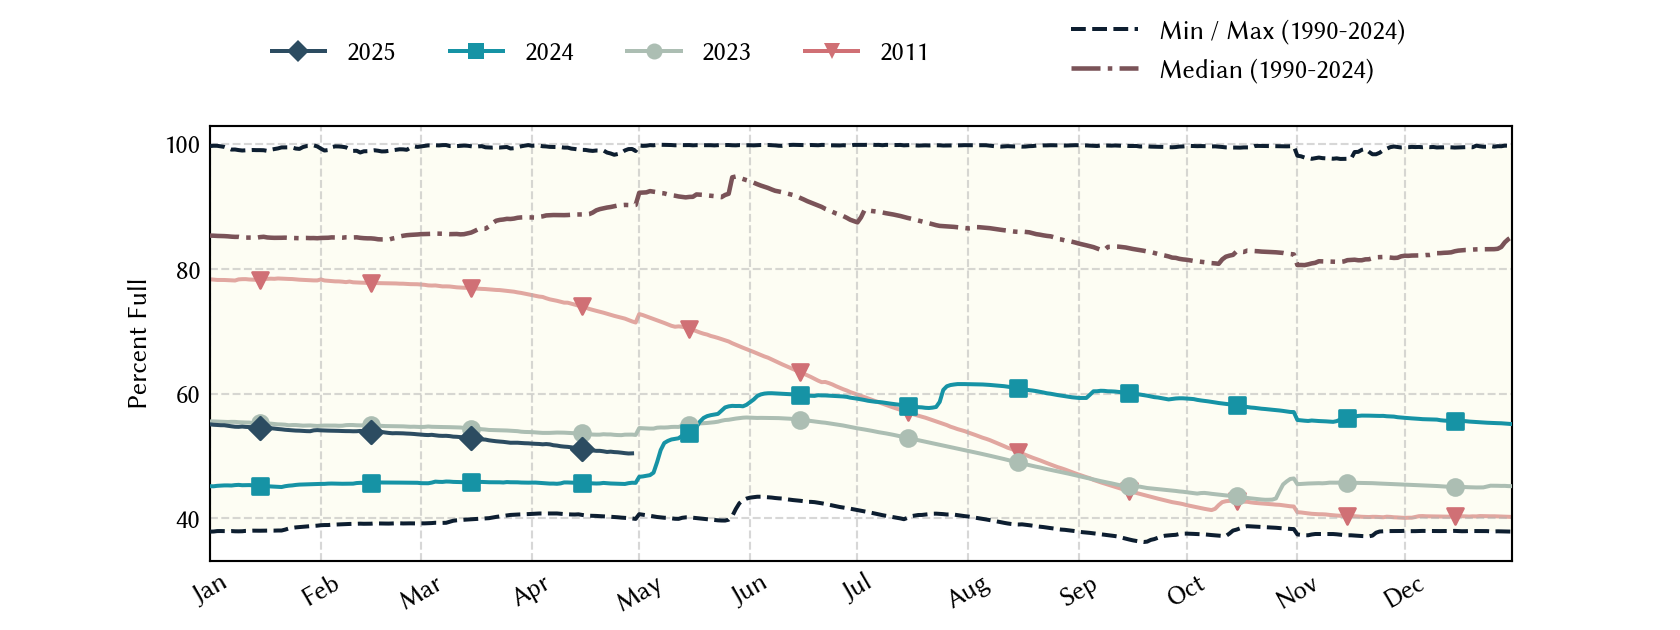
Lower-Colorado Planning Region Reservoirs: Monitored Water Supply Reservoirs are 45.6% full on 2024-04-18
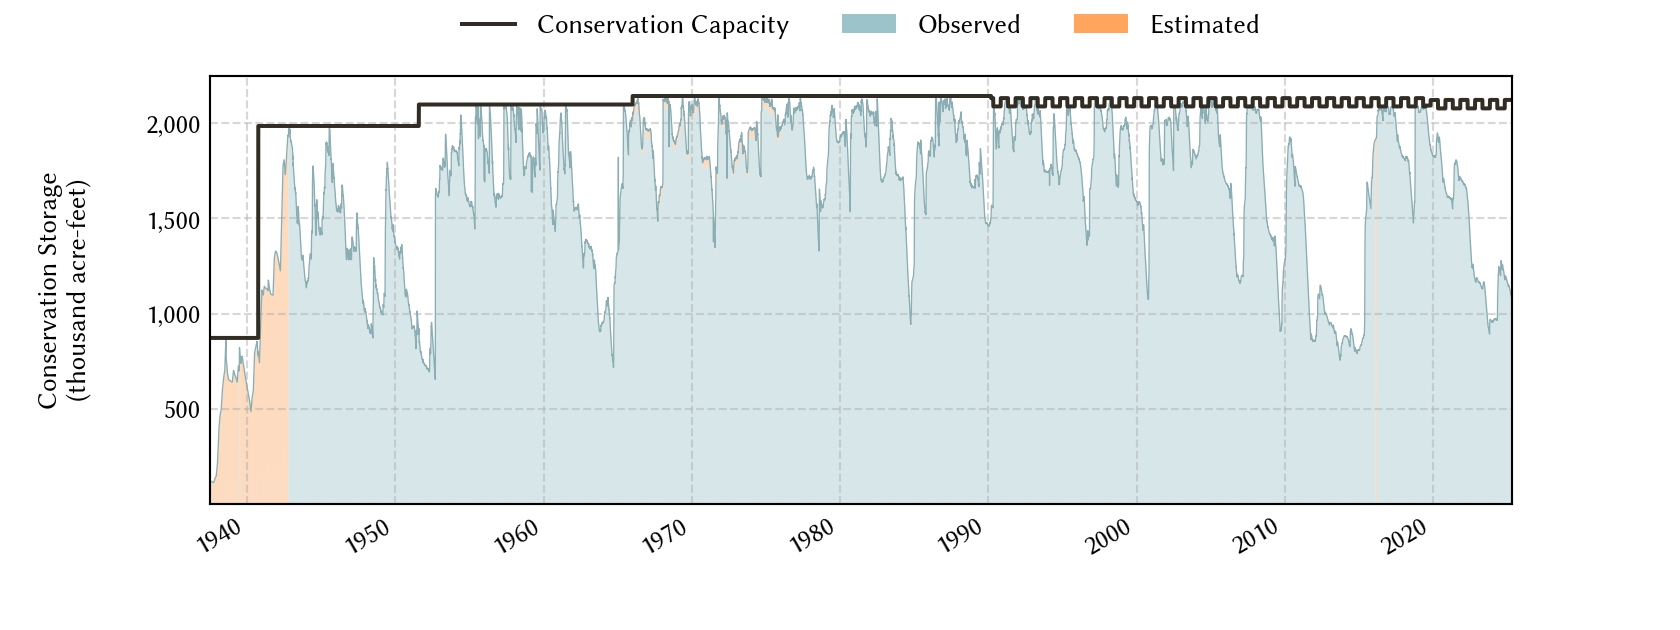
Historical Data
| Date | Percent Full |
Reservoir Storage (acre-ft) |
Conservation Storage (acre-ft) |
Conservation Capacity (acre-ft) |
|
|---|---|---|---|---|---|
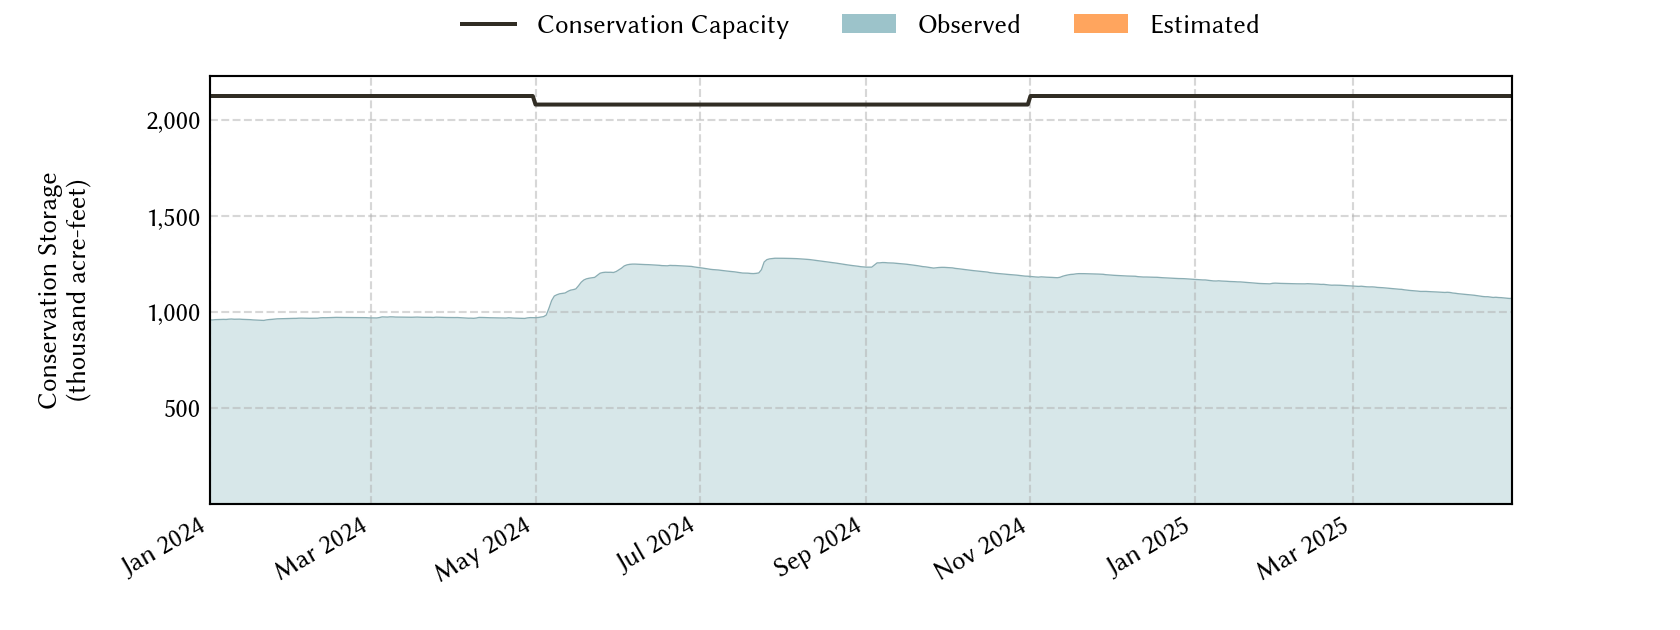
| Most recent | 2024-04-18 | 45.6 | 1,018,173 | 967,747 | 2,122,814 |
| 1 day prior | 2024-04-17 | 45.6 | 1,018,574 | 968,148 | 2,122,814 |
| 2 days prior | 2024-04-16 | 45.6 | 1,018,971 | 968,545 | 2,122,814 |
| 1 week prior | 2024-04-11 | 45.7 | 1,021,106 | 970,680 | 2,122,814 |
| 1 month prior | 2024-03-18 | 45.8 | 1,022,934 | 972,508 | 2,122,814 |
| 3 months prior | 2024-01-18 | 45.1 | 1,007,558 | 957,132 | 2,122,814 |
| 6 months prior | 2023-10-18 | 43.2 | 949,000 | 898,574 | 2,078,327 |
| 1 year prior | 2023-04-18 | 53.4 | 1,184,395 | 1,133,969 | 2,122,814 |
*
Percent Full is based on Conservation Storage and Conservation Capacity and doesn't account for storage in flood pool.
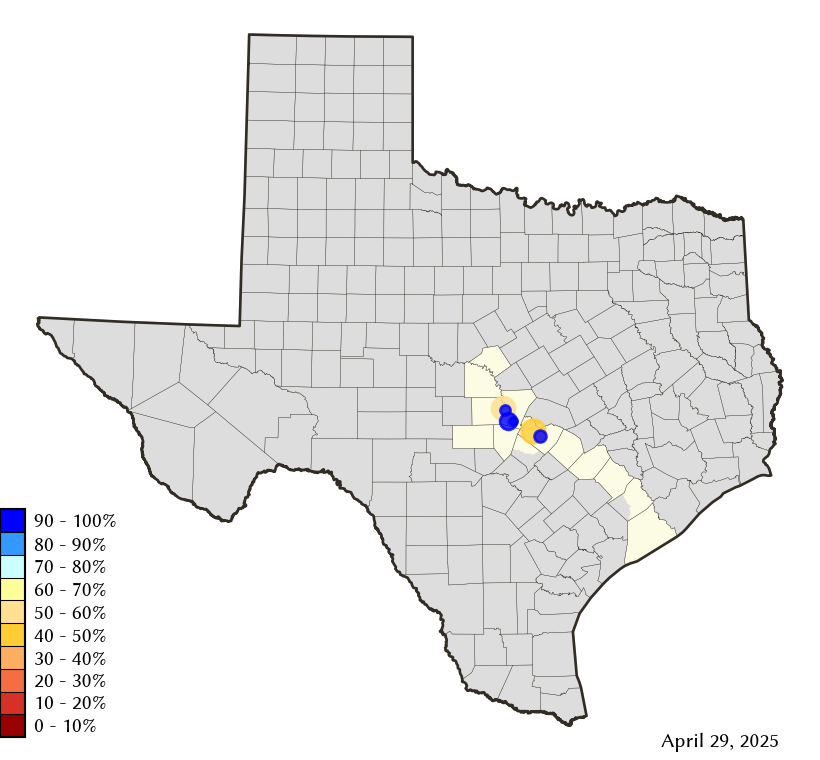
Area Map
Reservoir Storage
| Reservoir | Percent Full |
Water Level (ft) |
Height Above Conservation Pool (ft) |
Reservoir Storage (acre-ft) |
Conservation Storage (acre-ft) |
Conservation Capacity (acre-ft) |
Surface Area (acres) |
|---|---|---|---|---|---|---|---|
| Austin | 96.2 | 492.21 | -0.59 | 23,659 | 23,050 | 23,972 | 1,546 |
| Buchanan | 46.5 | 995.10 | -24.90 | 416,920 | 403,258 | 866,694 | 14,251 |
| Inks | 95.8 | 887.28 | -0.72 | 13,438 | 13,155 | 13,729 | 791 |
| Lyndon B Johnson | 98.5 | 824.74 | -0.26 | 129,949 | 111,109 | 112,778 | 6,407 |
| Marble Falls | 95.7 | 736.46 | -0.54 | 7,269 | 7,269 | 7,597 | 603 |
| Travis | 37.3 | 630.59 | -50.41 | 426,938 | 409,906 | 1,098,044 | 9,260 |