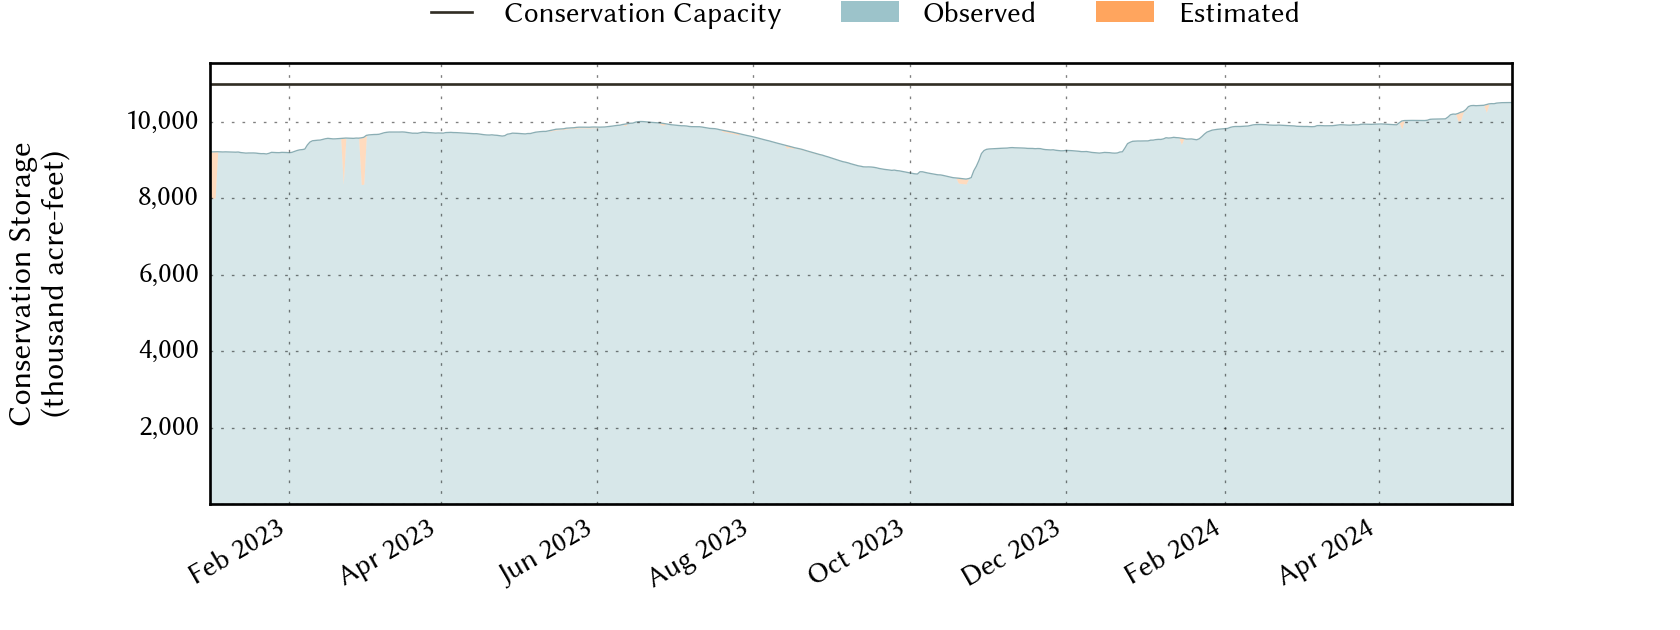
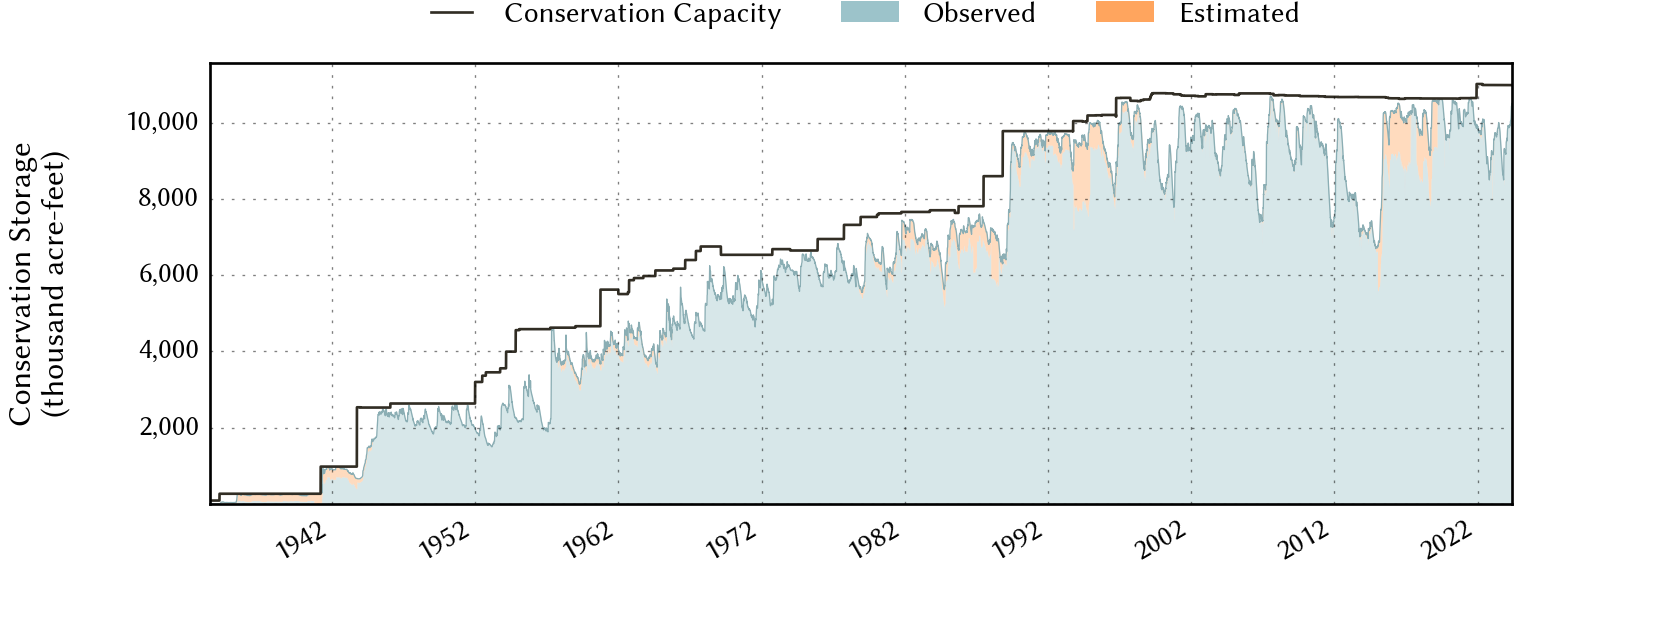
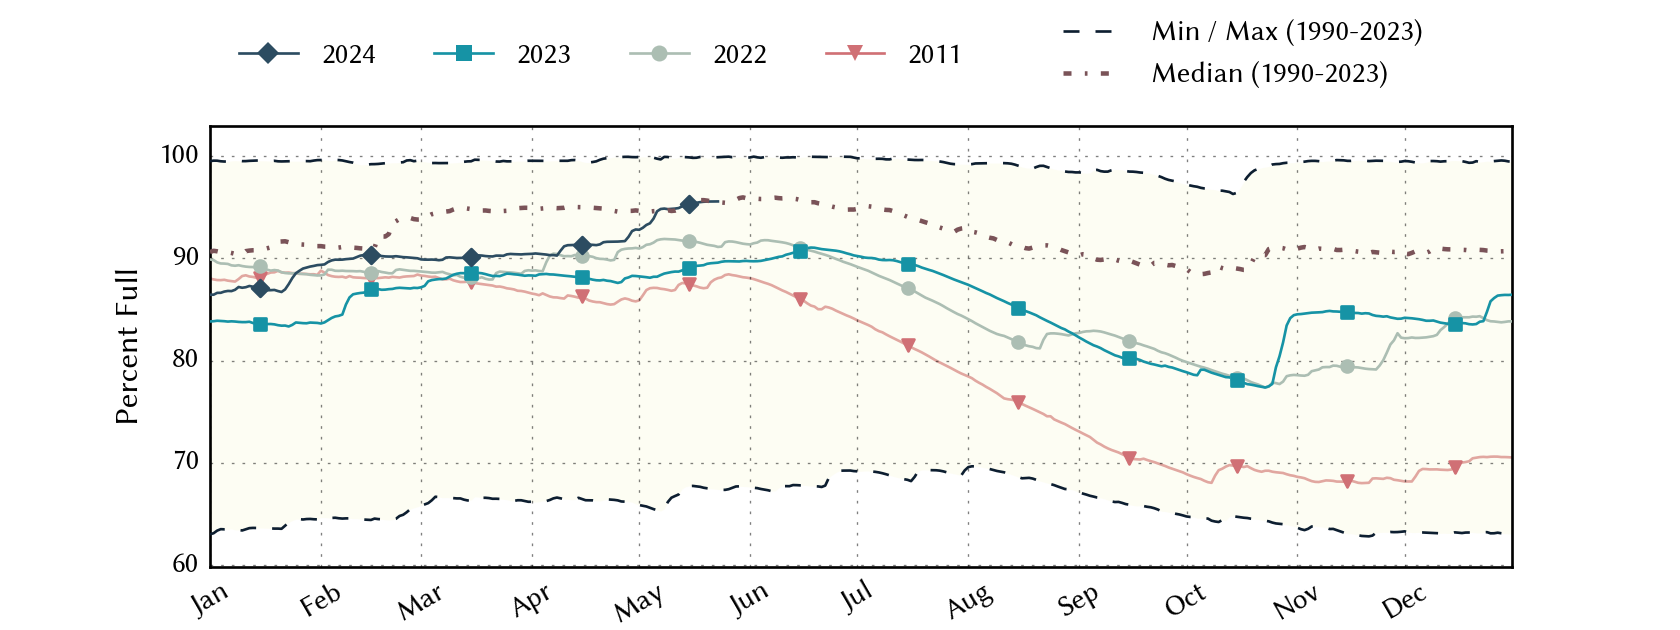
North-Central Climate Division Reservoirs: Monitored Water Supply Reservoirs are 92.8% full on 2024-05-01
Historical Data
| Date | Percent Full |
Reservoir Storage (acre-ft) |
Conservation Storage (acre-ft) |
Conservation Capacity (acre-ft) |
|
|---|---|---|---|---|---|
| Today | 2024-05-01 | 92.8 | 12,258,488 | 10,195,130 | 10,984,350 |
| Yesterday | 2024-04-30 | 92.8 | 12,213,716 | 10,197,298 | 10,984,350 |
| 2 days ago | 2024-04-29 | 92.7 | 12,108,815 | 10,180,437 | 10,984,350 |
| 1 week ago | 2024-04-24 | 91.6 | 11,686,246 | 10,067,107 | 10,984,350 |
| 1 month ago | 2024-04-01 | 90.5 | 11,406,285 | 9,936,152 | 10,984,350 |
| 3 months ago | 2024-02-01 | 89.4 | 11,273,720 | 9,817,084 | 10,984,350 |
| 6 months ago | 2023-11-01 | 84.5 | 10,608,172 | 9,285,161 | 10,984,350 |
| 1 year ago | 2023-05-01 | 88.2 | 11,024,844 | 9,693,279 | 10,984,350 |
*
Percent Full is based on Conservation Storage and Conservation Capacity and doesn't account for storage in flood pool.
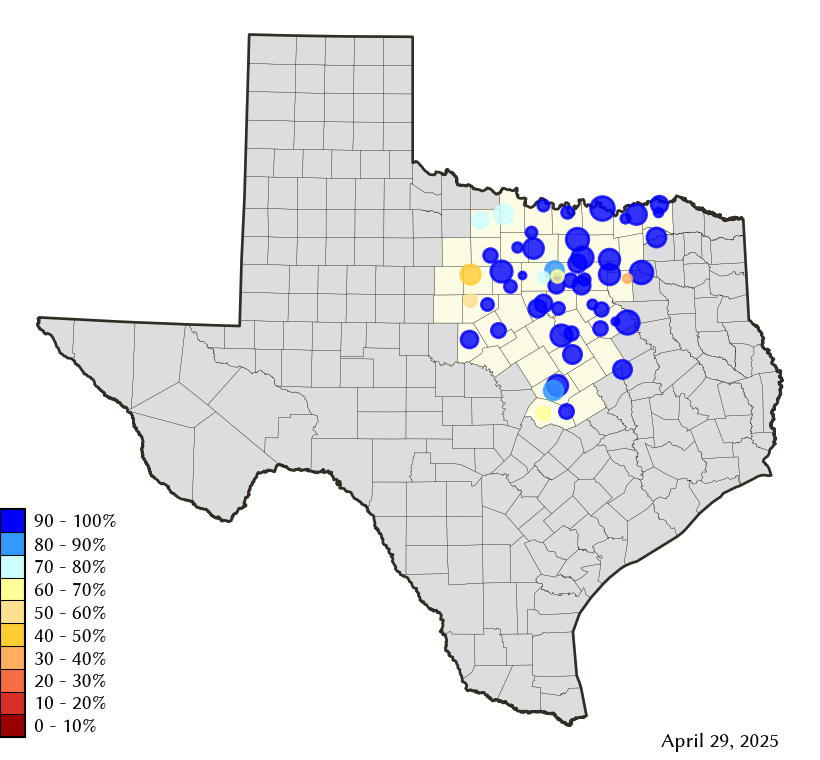
Area Map
Reservoir Storage
| Reservoir | Percent Full |
Water Level (ft) |
Height Above Conservation Pool (ft) |
Reservoir Storage (acre-ft) |
Conservation Storage (acre-ft) |
Conservation Capacity (acre-ft) |
Surface Area (acres) |
|---|---|---|---|---|---|---|---|
| Amon G Carter | 100.0 | 920.71 | 0.71 | 21,166 | 19,266 | 19,266 | 1,537 |
| Aquilla | 100.0 | 545.27 | 7.77 | 70,869 | 43,243 | 43,243 | - n.a. - |
| Arlington | 100.0 | 551.30 | 1.30 | 42,710 | 40,157 | 40,157 | - n.a. - |
| Arrowhead | 59.3 | 918.54 | -7.46 | 136,498 | 136,498 | 230,359 | 10,658 |
| Bardwell | 100.0 | 430.11 | 9.11 | 79,495 | 43,856 | 43,856 | 4,548 |
| Belton | 82.5 | 587.49 | -6.51 | 356,759 | 356,759 | 432,631 | 10,951 |
| Benbrook | 100.0 | 697.59 | 3.59 | 99,842 | 85,648 | 85,648 | - n.a. - |
| Bois d'Arc | 100.0 | 534.08 | 0.08 | 368,971 | 367,609 | 367,609 | 16,562 |
| Bonham | 100.0 | 565.58 | 0.58 | 11,668 | 11,027 | 11,027 | 1,100 |
| Bridgeport | 60.2 | 822.16 | -13.84 | 223,881 | 223,881 | 372,183 | 9,185 |
| Brownwood | 58.5 | 1,415.61 | -8.99 | 76,615 | 76,615 | 130,868 | 4,882 |
| Cisco | 60.9 | 1,510.80 | -11.66 | 17,653 | 17,653 | 29,003 | 758 |
| Crook | 100.0 | 476.17 | 0.17 | 9,389 | 9,195 | 9,195 | - n.a. - |
| Eagle Mountain | 86.4 | 646.23 | -2.87 | 159,872 | 159,872 | 185,087 | 8,374 |
| Georgetown | 80.7 | 785.03 | -5.97 | 30,742 | 30,679 | 38,005 | 1,149 |
| Graham | 71.3 | 1,069.27 | -5.73 | 32,315 | 32,301 | 45,288 | 2,025 |
| Granbury | 97.3 | 692.25 | -0.45 | 130,218 | 129,309 | 132,949 | 8,008 |
| Granger | 100.0 | 506.57 | 2.57 | 63,097 | 51,822 | 51,822 | - n.a. - |
| Grapevine | 100.0 | 538.86 | 3.86 | 190,356 | 163,064 | 163,064 | - n.a. - |
| Halbert | 88.9 | 366.81 | -1.19 | 5,362 | 5,362 | 6,033 | 550 |
| Hubbard Creek | 50.6 | 1,171.19 | -12.12 | 163,494 | 158,618 | 313,298 | 10,042 |
| Hubert H Moss | 100.0 | 715.49 | 0.49 | 24,687 | 24,058 | 24,058 | - n.a. - |
| Jim Chapman | 100.0 | 442.00 | 2.00 | 331,667 | 258,723 | 258,723 | 19,179 |
| Joe Pool | 100.0 | 524.34 | 2.34 | 167,254 | 149,629 | 149,629 | 7,203 |
| Kickapoo | 61.2 | 1,038.46 | -6.54 | 52,856 | 52,856 | 86,345 | 4,378 |
| Lavon | 100.0 | 494.89 | 2.89 | 474,702 | 409,757 | 409,757 | 22,807 |
| Leon | 47.4 | 1,364.45 | -10.55 | 13,426 | 13,146 | 27,762 | 1,077 |
| Lewisville | 100.0 | 524.53 | 2.53 | 669,467 | 563,228 | 563,228 | - n.a. - |
| Limestone | 100.0 | 363.18 | 0.18 | 206,019 | 203,780 | 203,780 | - n.a. - |
| Lost Creek | 94.6 | 1,007.96 | -1.54 | 11,308 | 11,308 | 11,950 | - n.a. - |
| Mineral Wells | 100.0 | 863.45 | 0.45 | 5,485 | 5,273 | 5,273 | 479 |
| Mountain Creek | 100.0 | 457.68 | 0.68 | 24,664 | 22,850 | 22,850 | 2,886 |
| Navarro Mills | 100.0 | 429.78 | 5.28 | 77,413 | 49,827 | 49,827 | - n.a. - |
| New Terrell City | 70.7 | 500.86 | -3.14 | 6,076 | 6,065 | 8,583 | 716 |
| Nocona | 73.7 | 823.02 | -4.48 | 16,115 | 15,811 | 21,444 | 1,166 |
| Palo Pinto | 41.1 | 858.53 | -8.47 | 11,394 | 11,008 | 26,766 | 1,393 |
| Pat Cleburne | 100.0 | 734.46 | 0.96 | 27,525 | 26,008 | 26,008 | - n.a. - |
| Pat Mayse | 100.0 | 453.89 | 2.89 | 134,588 | 113,683 | 113,683 | - n.a. - |
| Possum Kingdom | 99.0 | 998.71 | -0.29 | 532,964 | 532,964 | 538,139 | 17,777 |
| Proctor | 29.9 | 1,149.80 | -12.20 | 16,348 | 16,348 | 54,762 | 1,975 |
| Ray Hubbard | 100.0 | 435.54 | 0.04 | 440,399 | 439,559 | 439,559 | 20,998 |
| Ray Roberts | 100.0 | 634.01 | 1.51 | 832,060 | 788,167 | 788,167 | - n.a. - |
| Richland-Chambers | 100.0 | 315.99 | 0.99 | 1,169,027 | 1,099,417 | 1,099,417 | - n.a. - |
| Squaw Creek | 100.0 | 775.70 | 0.70 | 153,500 | 151,250 | 151,250 | - n.a. - |
| Stillhouse Hollow | 67.9 | 608.64 | -13.36 | 156,065 | 155,979 | 229,796 | 4,699 |
| Tawakoni | 100.0 | 439.70 | 2.20 | 955,654 | 871,685 | 871,685 | - n.a. - |
| Texoma 1 | 100.0 | 618.31 | 1.31 | 2,589,172 | 1,243,801 | 1,243,801 | 80,255 |
| Waco | 100.0 | 464.15 | 1.95 | 205,783 | 189,418 | 189,418 | - n.a. - |
| Waxahachie | 100.0 | 532.24 | 0.74 | 12,144 | 11,060 | 11,060 | 693 |
| Weatherford | 79.7 | 892.47 | -3.53 | 14,188 | 14,188 | 17,812 | 973 |
| Whitney | 100.0 | 534.80 | 1.80 | 609,448 | 564,808 | 564,808 | - n.a. - |
| Worth | 69.8 | 591.76 | -2.24 | 26,118 | 17,042 | 24,419 | 3,152 |
footnotes
1
Lake Texoma straddles the border of Texas and Oklahoma, Texas has rights to 50% of Lake Texoma's total conservation capacity. Percent full, conservation storage and conservation capacity are based on the Texas share.