Low-Rolling-Plains Climate Division Reservoirs: Monitored Water Supply Reservoirs are 53.3% full on 2024-04-25
Historical Data
| Date | Percent Full |
Reservoir Storage (acre-ft) |
Conservation Storage (acre-ft) |
Conservation Capacity (acre-ft) |
|
|---|---|---|---|---|---|
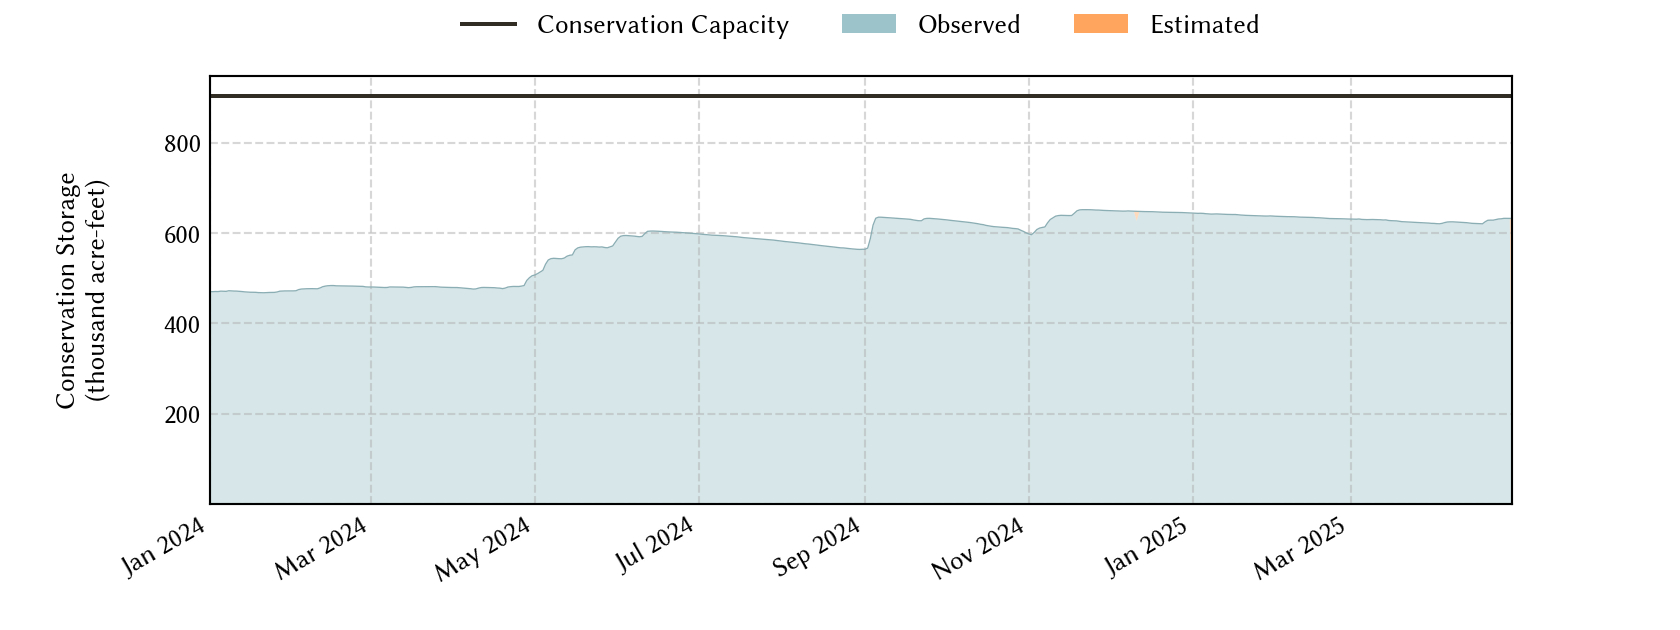
| Today | 2024-04-25 | 53.3 | 484,392 | 481,848 | 903,870 |
| Yesterday | 2024-04-24 | 53.3 | 484,441 | 481,897 | 903,870 |
| 2 days ago | 2024-04-23 | 53.3 | 484,408 | 481,864 | 903,870 |
| 1 week ago | 2024-04-18 | 53.1 | 482,106 | 479,562 | 903,870 |
| 1 month ago | 2024-03-25 | 53.4 | 485,072 | 482,528 | 903,870 |
| 3 months ago | 2024-01-25 | 52.1 | 473,319 | 470,775 | 903,870 |
| 6 months ago | 2023-10-25 | 50.9 | 462,261 | 459,717 | 903,870 |
| 1 year ago | 2023-04-25 | 49.7 | 451,457 | 448,913 | 903,870 |
*
Percent Full is based on Conservation Storage and Conservation Capacity and doesn't account for storage in flood pool.
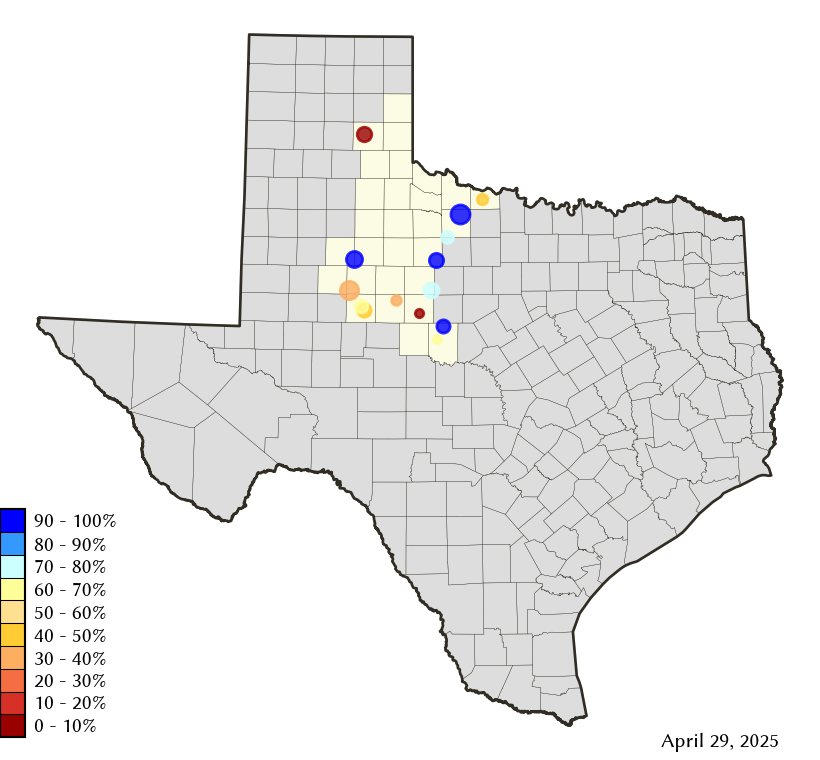
Area Map
Reservoir Storage
| Reservoir | Percent Full |
Water Level (ft) |
Height Above Conservation Pool (ft) |
Reservoir Storage (acre-ft) |
Conservation Storage (acre-ft) |
Conservation Capacity (acre-ft) |
Surface Area (acres) |
|---|---|---|---|---|---|---|---|
| Abilene | 11.7 | 1,993.67 | -18.63 | 925 | 925 | 7,900 | 167 |
| Alan Henry | 87.1 | 2,215.28 | -4.72 | 83,777 | 83,777 | 96,207 | 2,466 |
| Champion Creek | 57.3 | 2,068.90 | -14.10 | 23,810 | 23,810 | 41,580 | 1,032 |
| Coleman | 59.6 | 1,707.98 | -9.52 | 22,715 | 22,697 | 38,075 | 1,368 |
| Colorado City | 46.5 | 2,056.83 | -13.37 | 14,306 | 14,306 | 30,758 | - n.a. - |
| Fort Phantom Hill | 66.6 | 1,629.04 | -6.86 | 46,661 | 46,655 | 70,030 | 2,973 |
| Greenbelt | 11.3 | 2,618.06 | -45.94 | 7,217 | 6,785 | 59,968 | 465 |
| Hords Creek | 21.3 | 1,879.13 | -20.87 | 1,733 | 1,730 | 8,109 | 165 |
| J B Thomas | 19.5 | 2,225.76 | -32.24 | 39,711 | 39,038 | 199,931 | 3,067 |
| Kemp | 73.6 | 1,139.52 | -4.48 | 180,575 | 180,449 | 245,307 | 9,777 |
| Millers Creek | 49.3 | 1,325.86 | -8.14 | 14,472 | 13,189 | 26,768 | 1,181 |
| North Fork Buffalo Creek | 31.4 | 1,039.02 | -8.98 | 4,841 | 4,841 | 15,400 | 697 |
| Stamford | 73.9 | 1,414.11 | -2.69 | 38,098 | 38,095 | 51,570 | 4,101 |
| Sweetwater | 45.3 | 2,103.07 | -13.43 | 5,551 | 5,551 | 12,267 | 371 |