Region-C Planning Region Reservoirs: Monitored Water Supply Reservoirs are 96.0% full on 2024-04-26
Historical Data
| Date | Percent Full |
Reservoir Storage (acre-ft) |
Conservation Storage (acre-ft) |
Conservation Capacity (acre-ft) |
|
|---|---|---|---|---|---|
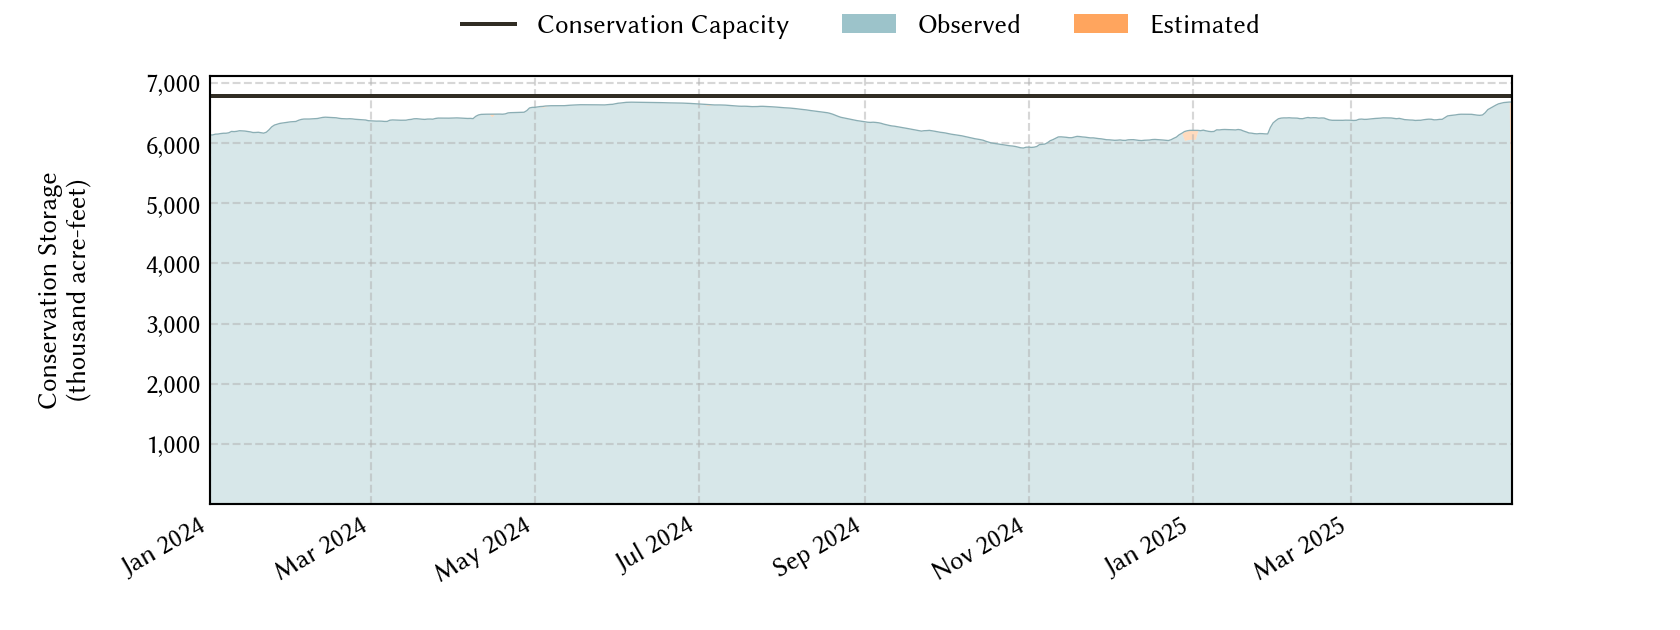
| Today | 2024-04-26 | 96.0 | 7,924,237 | 6,510,956 | 6,783,467 |
| Yesterday | 2024-04-25 | 96.0 | 7,937,688 | 6,511,161 | 6,783,467 |
| 2 days ago | 2024-04-24 | 96.0 | 7,962,383 | 6,510,111 | 6,783,467 |
| 1 week ago | 2024-04-19 | 95.5 | 7,836,263 | 6,481,331 | 6,783,467 |
| 1 month ago | 2024-03-26 | 94.6 | 7,823,895 | 6,416,841 | 6,783,467 |
| 3 months ago | 2024-01-26 | 93.1 | 7,643,353 | 6,313,871 | 6,783,467 |
| 6 months ago | 2023-10-26 | 83.1 | 6,846,303 | 5,635,617 | 6,783,467 |
| 1 year ago | 2023-04-26 | 94.2 | 7,645,491 | 6,388,249 | 6,783,467 |
*
Percent Full is based on Conservation Storage and Conservation Capacity and doesn't account for storage in flood pool.
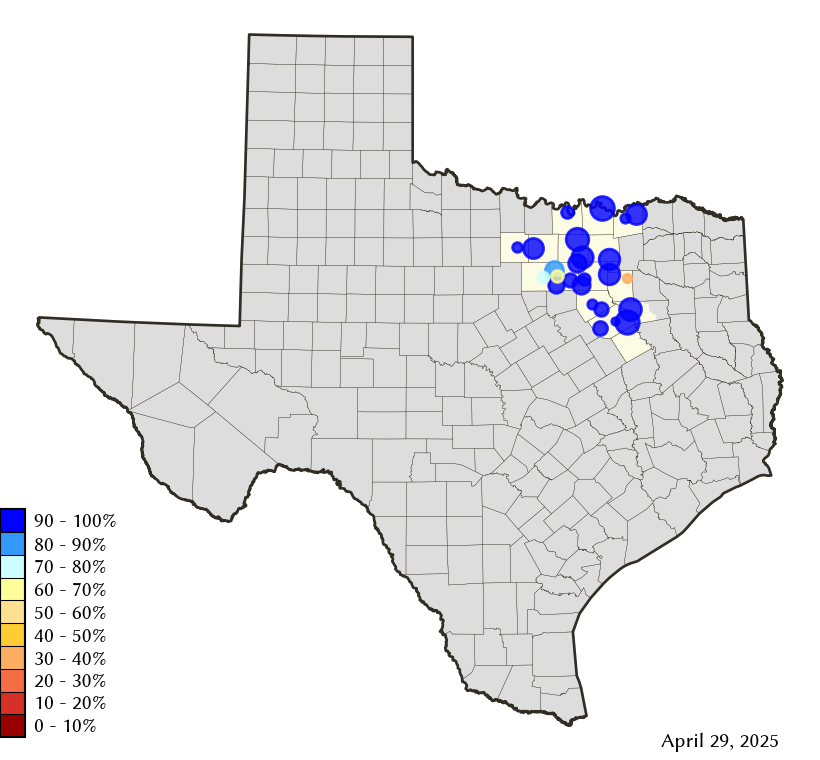
Area Map
Reservoir Storage
| Reservoir | Percent Full |
Water Level (ft) |
Height Above Conservation Pool (ft) |
Reservoir Storage (acre-ft) |
Conservation Storage (acre-ft) |
Conservation Capacity (acre-ft) |
Surface Area (acres) |
|---|---|---|---|---|---|---|---|
| Arlington | 100.0 | 550.36 | 0.36 | 40,882 | 40,157 | 40,157 | - n.a. - |
| Bardwell | 100.0 | 424.29 | 3.29 | 55,495 | 43,856 | 43,856 | 3,756 |
| Benbrook | 100.0 | 694.25 | 0.25 | 86,577 | 85,648 | 85,648 | - n.a. - |
| Bois d'Arc | 94.7 | 532.79 | -1.21 | 348,162 | 348,162 | 367,609 | 16,003 |
| Bonham | 100.0 | 565.13 | 0.13 | 11,178 | 11,027 | 11,027 | 1,077 |
| Bridgeport | 59.0 | 821.68 | -14.32 | 219,494 | 219,494 | 372,183 | 9,093 |
| Cedar Creek | 100.0 | 322.08 | 0.08 | 647,405 | 644,686 | 644,686 | - n.a. - |
| Eagle Mountain | 81.9 | 645.22 | -3.88 | 151,544 | 151,544 | 185,087 | 8,116 |
| Grapevine | 100.0 | 536.74 | 1.74 | 174,913 | 163,064 | 163,064 | - n.a. - |
| Halbert | 88.9 | 366.81 | -1.19 | 5,362 | 5,362 | 6,033 | 550 |
| Hubert H Moss | 99.6 | 714.91 | -0.09 | 24,058 | 23,961 | 24,058 | 1,084 |
| Joe Pool | 100.0 | 523.00 | 1.00 | 157,801 | 149,629 | 149,629 | 6,909 |
| Lavon | 100.0 | 493.24 | 1.24 | 438,604 | 409,757 | 409,757 | 21,281 |
| Lewisville | 100.0 | 523.05 | 1.05 | 627,646 | 563,228 | 563,228 | - n.a. - |
| Lost Creek | 93.6 | 1,007.58 | -1.92 | 11,180 | 11,180 | 11,950 | - n.a. - |
| Mountain Creek | 100.0 | 457.65 | 0.65 | 24,569 | 22,850 | 22,850 | 2,874 |
| Navarro Mills | 100.0 | 425.88 | 1.38 | 56,506 | 49,827 | 49,827 | - n.a. - |
| New Terrell City | 48.0 | 497.89 | -6.11 | 4,132 | 4,121 | 8,583 | 572 |
| Ray Hubbard | 100.0 | 435.54 | 0.04 | 440,399 | 439,559 | 439,559 | 20,998 |
| Ray Roberts | 100.0 | 633.50 | 1.00 | 817,178 | 788,167 | 788,167 | - n.a. - |
| Richland-Chambers | 100.0 | 315.23 | 0.23 | 1,135,312 | 1,099,417 | 1,099,417 | - n.a. - |
| Texoma 1 | 96.3 | 615.75 | -1.25 | 2,395,207 | 1,197,603 | 1,243,801 | 72,311 |
| Waxahachie | 100.0 | 532.07 | 0.57 | 12,027 | 11,060 | 11,060 | 687 |
| Weatherford | 74.0 | 891.41 | -4.59 | 13,172 | 13,172 | 17,812 | 945 |
| Worth | 61.6 | 591.11 | -2.89 | 24,109 | 15,033 | 24,419 | 3,019 |
footnotes
1
Lake Texoma straddles the border of Texas and Oklahoma, Texas has rights to 50% of Lake Texoma's total conservation capacity. Percent full, conservation storage and conservation capacity are based on the Texas share.