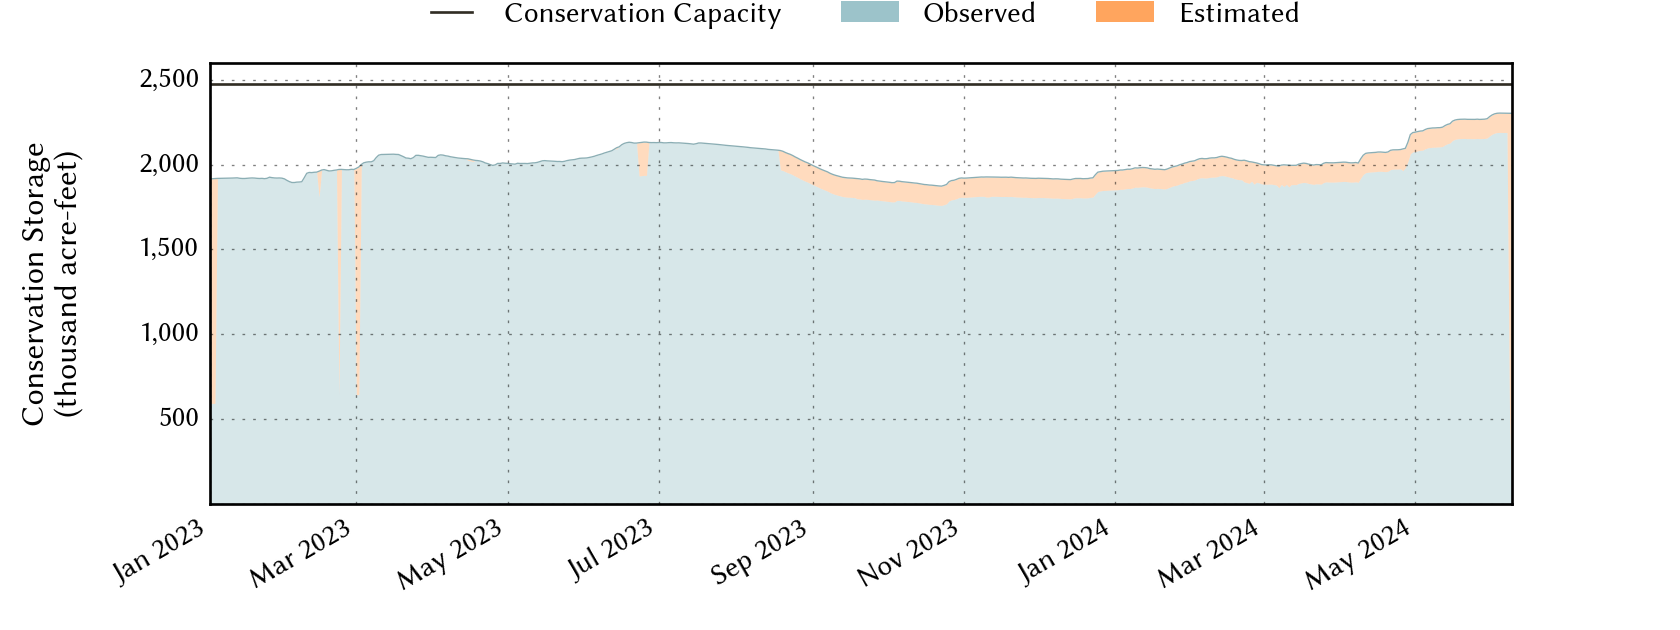
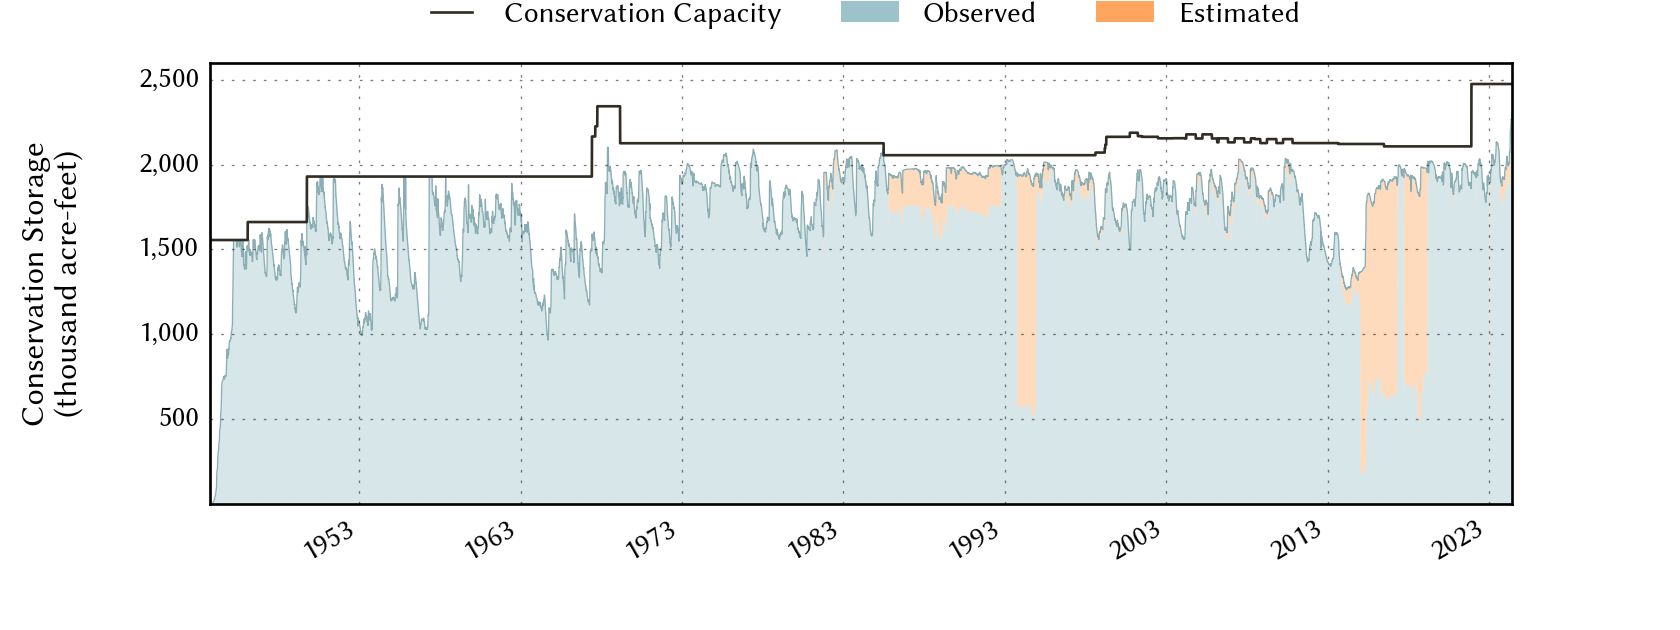
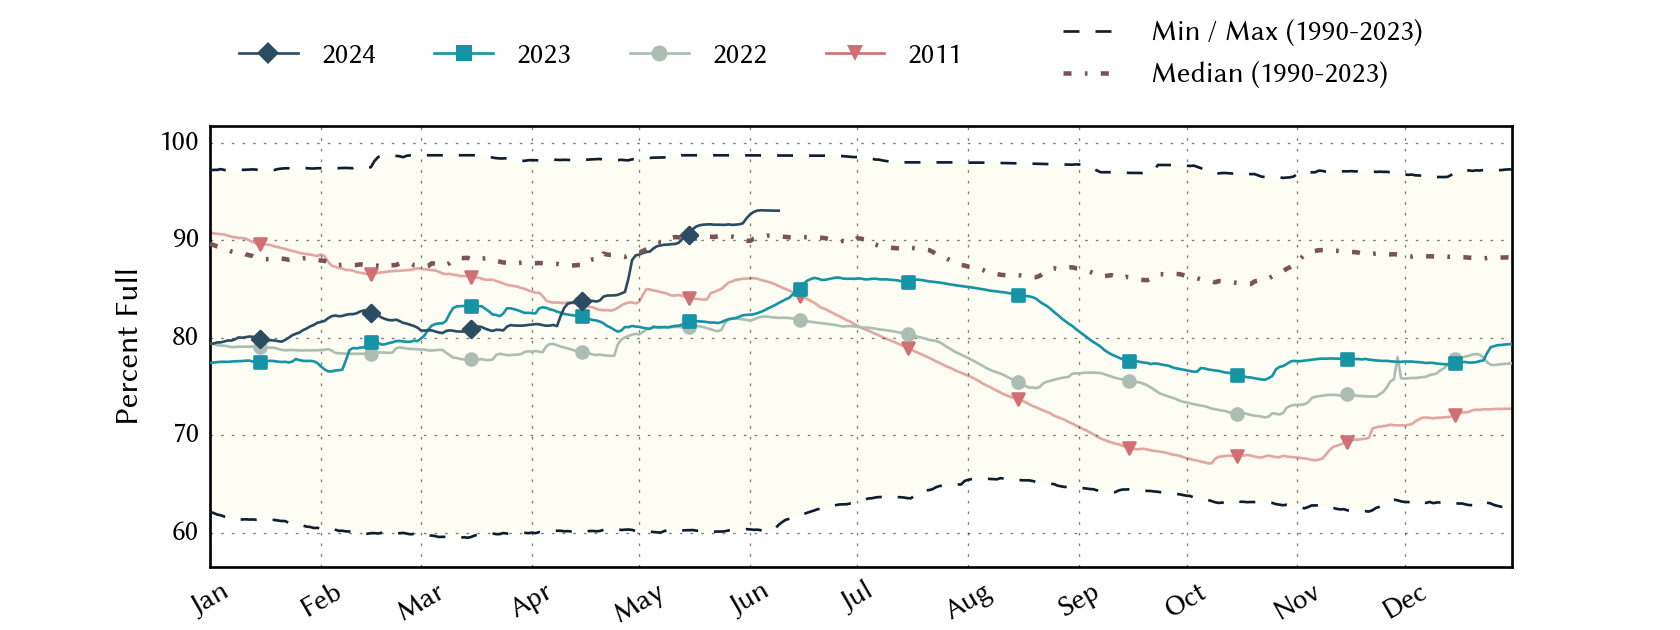
Red River Basin Reservoirs: Monitored Water Supply Reservoirs are 89.6% full on 2024-05-12
Historical Data
| Date | Percent Full |
Reservoir Storage (acre-ft) |
Conservation Storage (acre-ft) |
Conservation Capacity (acre-ft) |
|
|---|---|---|---|---|---|
| Today | 2024-05-12 | 89.6 | 3,948,053 | 2,217,669 | 2,474,646 |
| Yesterday | 2024-05-11 | 89.6 | 3,973,097 | 2,217,577 | 2,474,646 |
| 2 days ago | 2024-05-10 | 89.6 | 4,005,450 | 2,217,184 | 2,474,646 |
| 1 week ago | 2024-05-05 | 89.1 | 3,898,185 | 2,205,901 | 2,474,646 |
| 1 month ago | 2024-04-12 | 83.6 | 3,288,726 | 2,068,297 | 2,474,646 |
| 3 months ago | 2024-02-12 | 82.5 | 3,306,292 | 2,040,730 | 2,474,646 |
| 6 months ago | 2023-11-12 | 77.5 | 3,073,428 | 1,918,198 | 2,474,646 |
| 1 year ago | 2023-05-12 | 81.2 | 3,180,288 | 2,010,157 | 2,474,646 |
*
Percent Full is based on Conservation Storage and Conservation Capacity and doesn't account for storage in flood pool.
Area Map

Reservoir Storage
| Reservoir | Percent Full |
Water Level (ft) |
Height Above Conservation Pool (ft) |
Reservoir Storage (acre-ft) |
Conservation Storage (acre-ft) |
Conservation Capacity (acre-ft) |
Surface Area (acres) |
|---|---|---|---|---|---|---|---|
| Arrowhead | 64.5 | 919.65 | -6.35 | 148,646 | 148,646 | 230,359 | 11,231 |
| Bois d'Arc | 100.0 | 534.63 | 0.63 | 378,331 | 367,609 | 367,609 | 16,813 |
| Bonham | 100.0 | 565.35 | 0.35 | 11,416 | 11,027 | 11,027 | 1,088 |
| Crook | 99.9 | 475.99 | -0.01 | 9,200 | 9,185 | 9,195 | 1,058 |
| Greenbelt | 11.2 | 2,617.95 | -46.05 | 7,169 | 6,737 | 59,968 | 463 |
| Hubert H Moss | 100.0 | 715.22 | 0.22 | 24,393 | 24,058 | 24,058 | - n.a. - |
| Kemp | 83.8 | 1,141.90 | -2.10 | 205,812 | 205,686 | 245,307 | 11,617 |
| Kickapoo | 66.1 | 1,039.40 | -5.60 | 57,071 | 57,071 | 86,345 | 4,591 |
| Mackenzie | 9.1 | 3,014.43 | -85.57 | 4,230 | 4,230 | 46,450 | 208 |
| Nocona | 84.7 | 824.96 | -2.54 | 18,459 | 18,155 | 21,444 | 1,249 |
| North Fork Buffalo Creek | 50.5 | 1,042.32 | -5.68 | 7,781 | 7,781 | 15,400 | 950 |
| Pat Mayse | 100.0 | 453.58 | 2.58 | 132,749 | 113,683 | 113,683 | - n.a. - |
| Texoma 1 | 100.0 | 622.31 | 5.31 | 2,942,796 | 1,243,801 | 1,243,801 | 94,422 |
footnotes
1
Lake Texoma straddles the border of Texas and Oklahoma, Texas has rights to 50% of Lake Texoma's total conservation capacity. Percent full, conservation storage and conservation capacity are based on the Texas share.