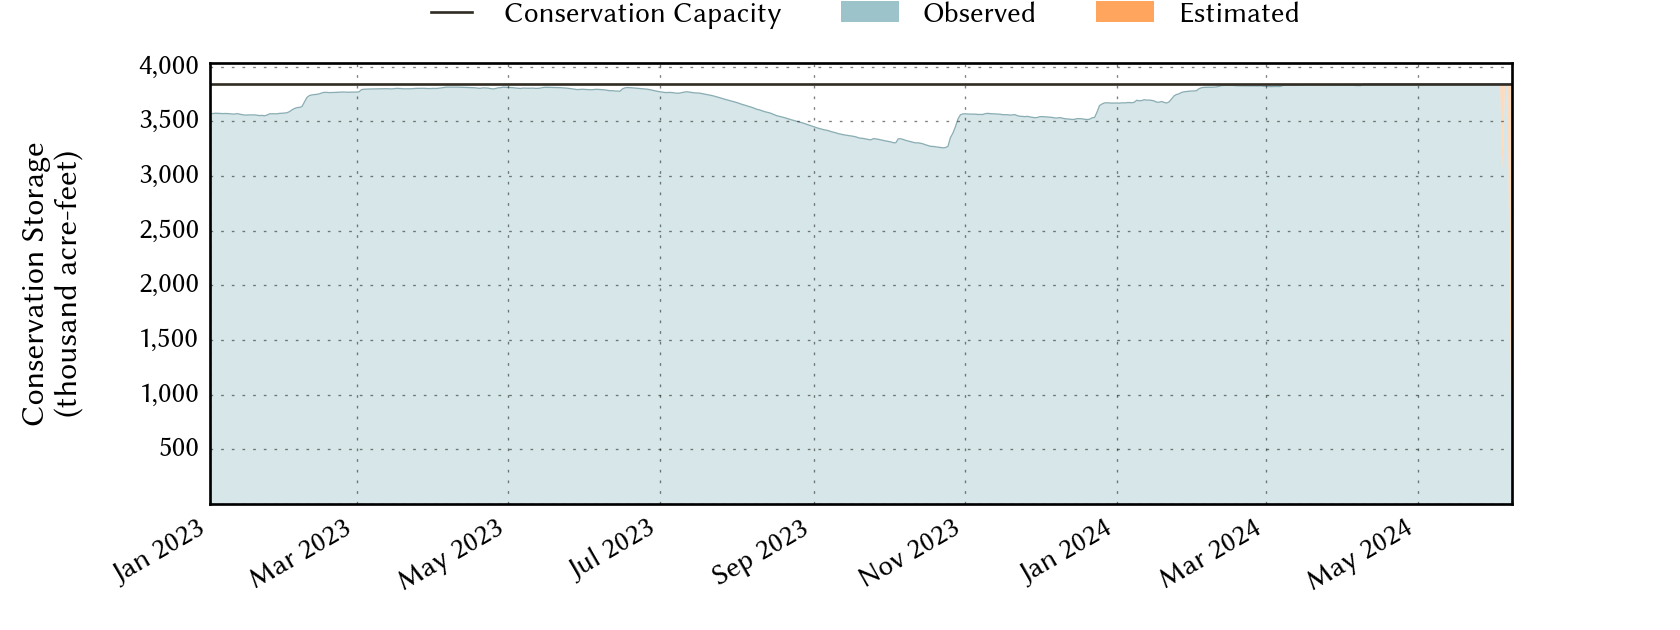
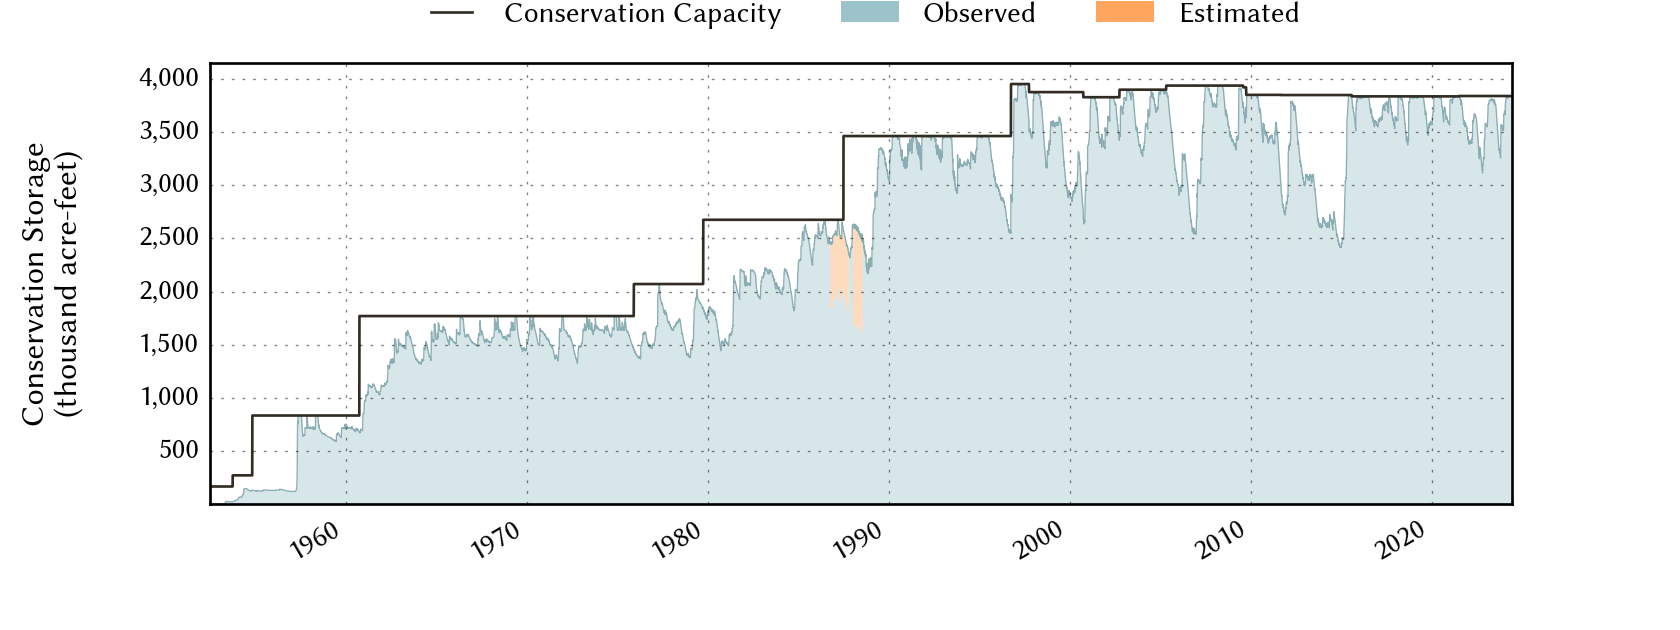
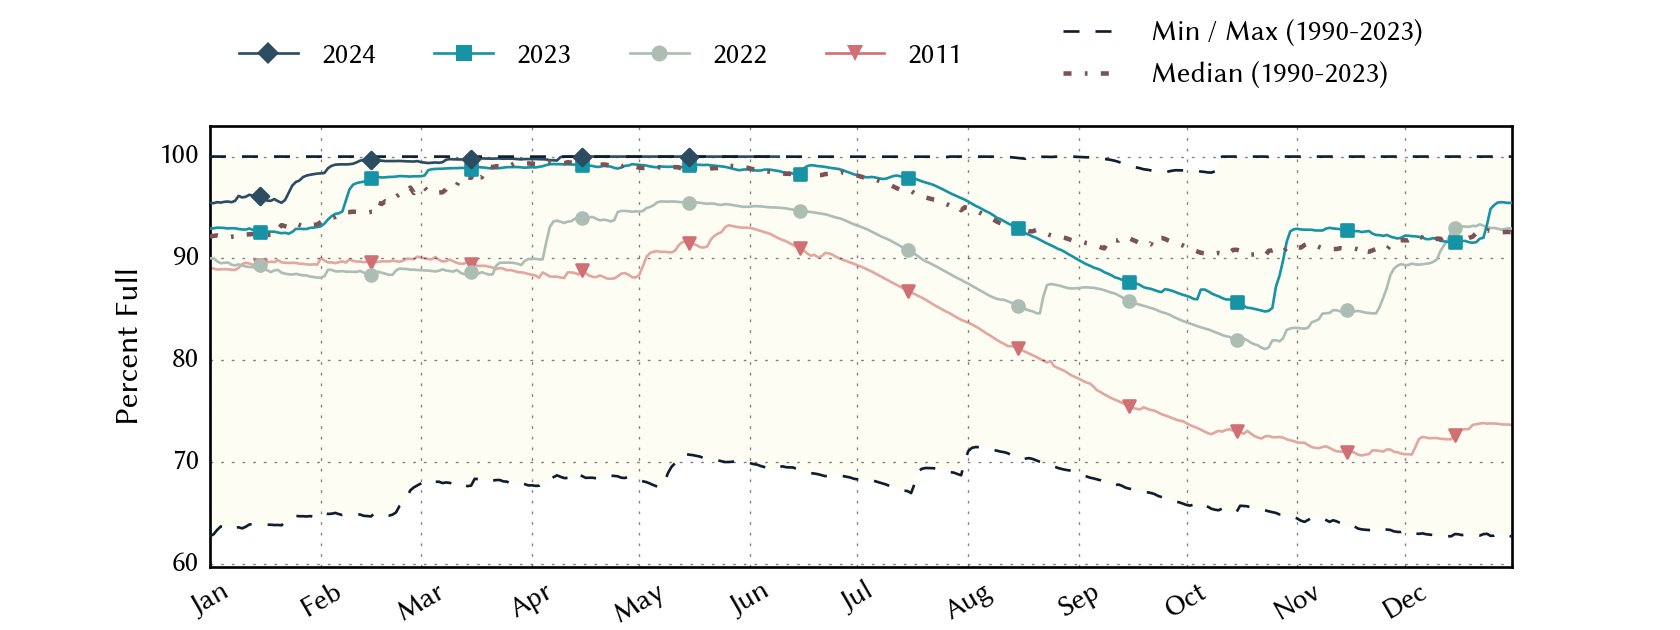
Dallas Area Reservoirs: Monitored Water Supply Reservoirs are 100.0% full on 2024-05-12
Historical Data
| Date | Percent Full |
Reservoir Storage (acre-ft) |
Conservation Storage (acre-ft) |
Conservation Capacity (acre-ft) |
|
|---|---|---|---|---|---|
| Today | 2024-05-12 | 100.0 | 4,335,356 | 3,840,521 | 3,840,521 |
| Yesterday | 2024-05-11 | 100.0 | 4,341,450 | 3,840,521 | 3,840,521 |
| 2 days ago | 2024-05-10 | 100.0 | 4,347,568 | 3,840,521 | 3,840,521 |
| 1 week ago | 2024-05-05 | 100.0 | 4,294,417 | 3,840,521 | 3,840,521 |
| 1 month ago | 2024-04-12 | 100.0 | 4,086,480 | 3,840,521 | 3,840,521 |
| 3 months ago | 2024-02-12 | 99.6 | 3,946,921 | 3,825,124 | 3,840,521 |
| 6 months ago | 2023-11-12 | 92.9 | 3,638,880 | 3,568,591 | 3,840,521 |
| 1 year ago | 2023-05-12 | 99.0 | 3,879,198 | 3,800,774 | 3,840,521 |
*
Percent Full is based on Conservation Storage and Conservation Capacity and doesn't account for storage in flood pool.
Area Map

Reservoir Storage
| Reservoir | Percent Full |
Water Level (ft) |
Height Above Conservation Pool (ft) |
Reservoir Storage (acre-ft) |
Conservation Storage (acre-ft) |
Conservation Capacity (acre-ft) |
Surface Area (acres) |
|---|---|---|---|---|---|---|---|
| Fork | 100.0 | 403.47 | 0.47 | 649,074 | 605,061 | 605,061 | - n.a. - |
| Grapevine | 100.0 | 543.76 | 8.76 | 230,279 | 163,064 | 163,064 | - n.a. - |
| Lavon | 100.0 | 497.14 | 5.14 | 528,127 | 409,757 | 409,757 | 24,520 |
| Lewisville | 100.0 | 525.18 | 3.18 | 688,317 | 563,228 | 563,228 | - n.a. - |
| Ray Hubbard | 100.0 | 435.51 | 0.01 | 439,769 | 439,559 | 439,559 | 20,960 |
| Ray Roberts | 100.0 | 635.37 | 2.87 | 872,575 | 788,167 | 788,167 | - n.a. - |
| Tawakoni | 100.0 | 438.97 | 1.47 | 927,215 | 871,685 | 871,685 | - n.a. - |