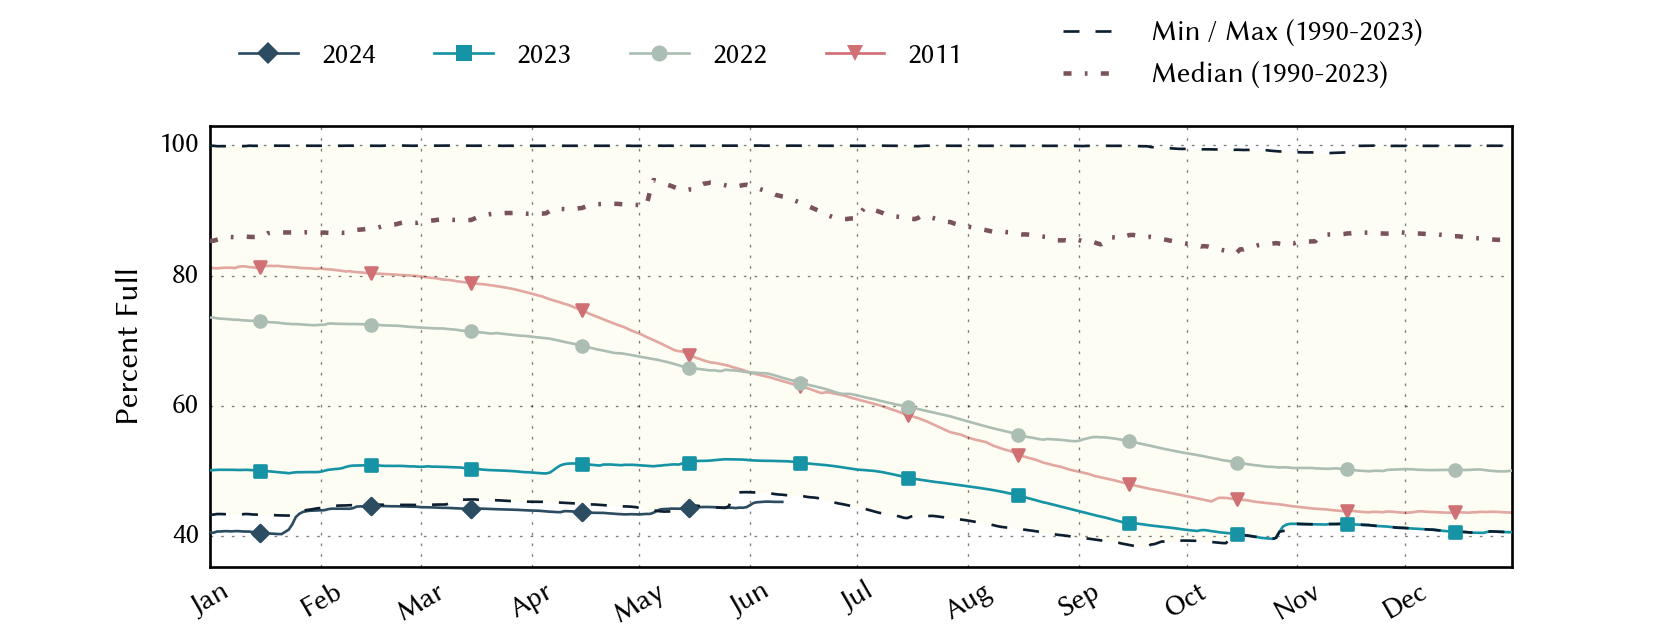
South-Central Climate Division Reservoirs: Monitored Water Supply Reservoirs are 44.2% full on 2024-05-12
Historical Data
| Date | Percent Full |
Reservoir Storage (acre-ft) |
Conservation Storage (acre-ft) |
Conservation Capacity (acre-ft) |
|
|---|---|---|---|---|---|
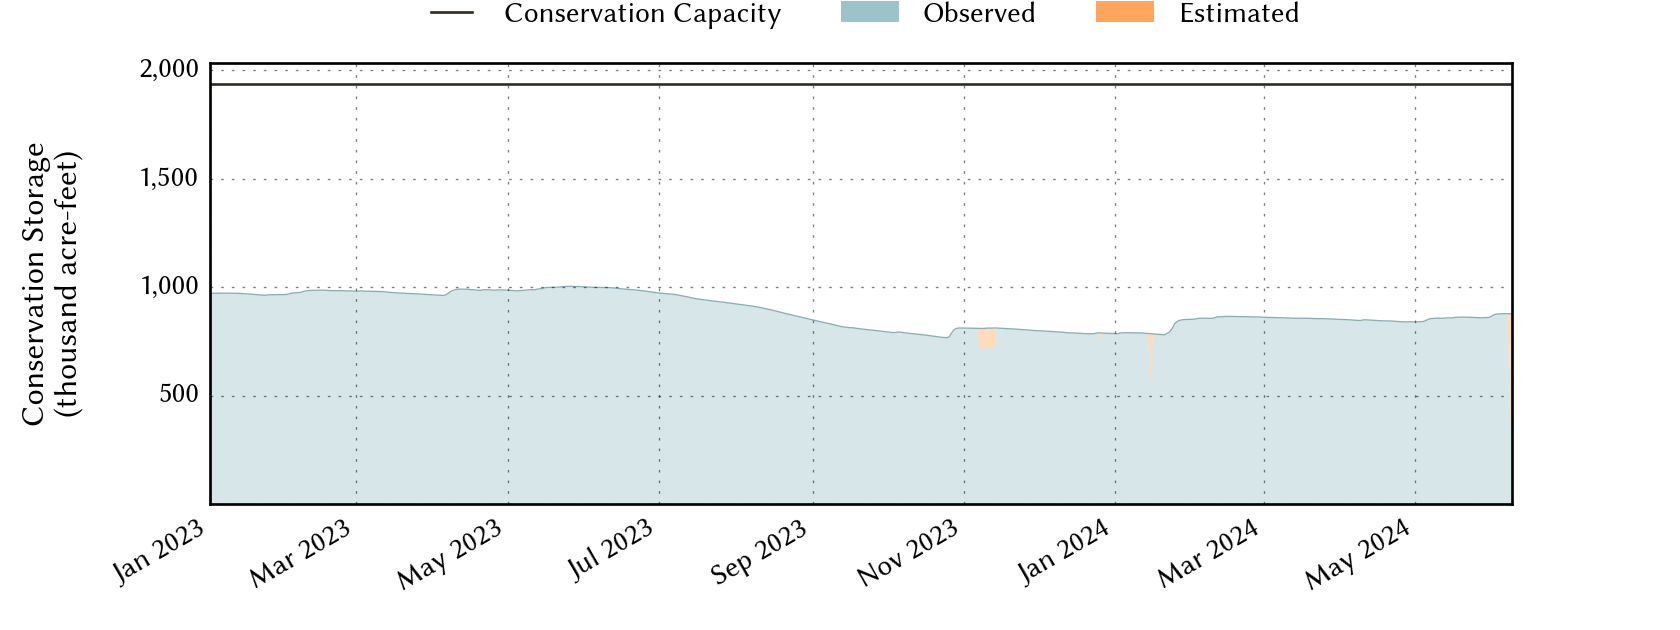
| Today | 2024-05-12 | 44.2 | 886,061 | 856,610 | 1,936,953 |
| Yesterday | 2024-05-11 | 44.2 | 886,265 | 856,696 | 1,936,953 |
| 2 days ago | 2024-05-10 | 44.2 | 886,575 | 857,006 | 1,936,953 |
| 1 week ago | 2024-05-05 | 43.6 | 871,523 | 844,880 | 1,936,953 |
| 1 month ago | 2024-04-12 | 43.8 | 872,322 | 848,690 | 1,936,953 |
| 3 months ago | 2024-02-12 | 44.6 | 884,561 | 863,529 | 1,936,953 |
| 6 months ago | 2023-11-12 | 41.9 | 828,780 | 811,068 | 1,936,953 |
| 1 year ago | 2023-05-12 | 51.0 | 1,034,737 | 987,793 | 1,936,953 |
*
Percent Full is based on Conservation Storage and Conservation Capacity and doesn't account for storage in flood pool.
Area Map

Reservoir Storage
| Reservoir | Percent Full |
Water Level (ft) |
Height Above Conservation Pool (ft) |
Reservoir Storage (acre-ft) |
Conservation Storage (acre-ft) |
Conservation Capacity (acre-ft) |
Surface Area (acres) |
|---|---|---|---|---|---|---|---|
| Austin | 94.9 | 492.02 | -0.78 | 23,366 | 22,757 | 23,972 | 1,535 |
| Canyon | 58.4 | 886.36 | -22.64 | 221,159 | 221,088 | 378,781 | 5,783 |
| Coleto Creek | 95.4 | 97.39 | -0.61 | 29,610 | 29,610 | 31,040 | 2,568 |
| Medina | 2.7 | 972.24 | -91.96 | 6,825 | 6,825 | 254,823 | 603 |
| Somerville | 100.0 | 239.02 | 1.02 | 162,032 | 150,293 | 150,293 | - n.a. - |
| Travis | 38.8 | 632.31 | -48.69 | 443,069 | 426,037 | 1,098,044 | 9,498 |