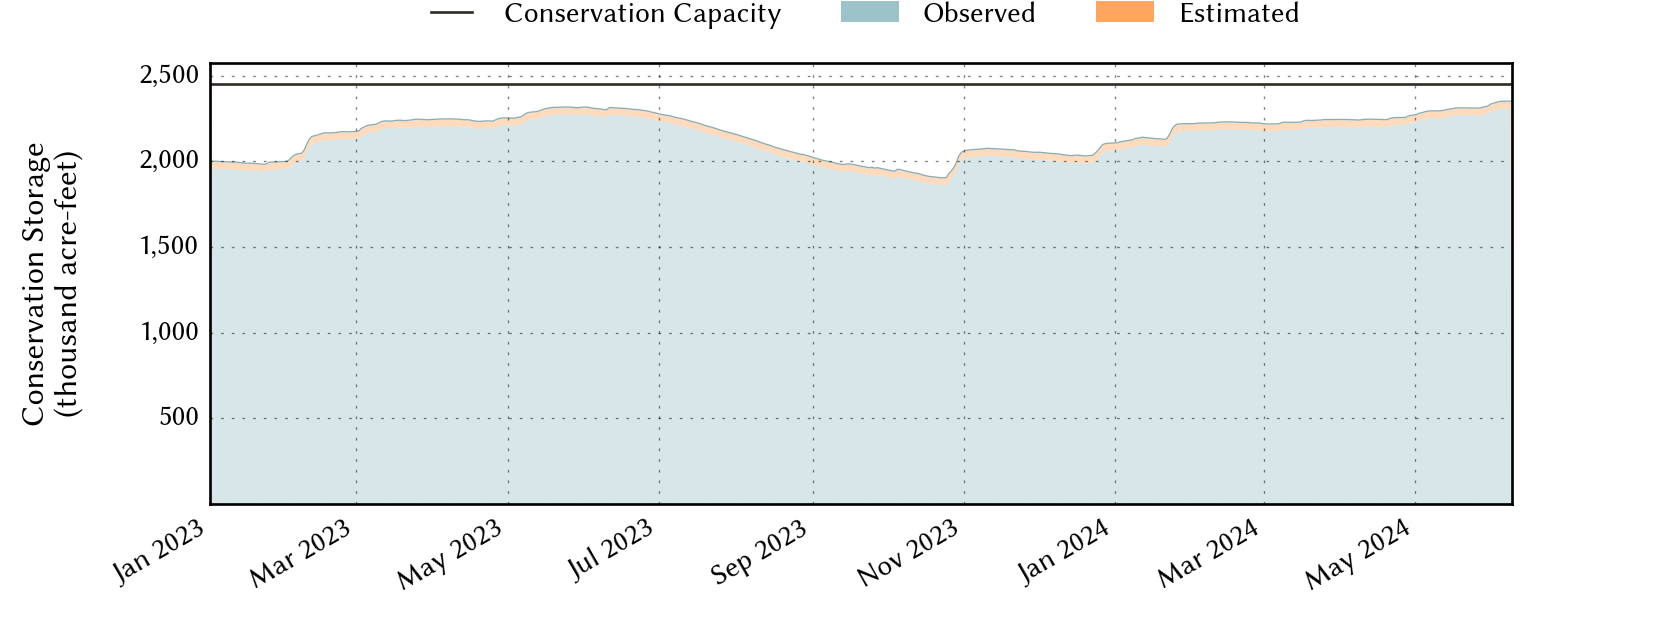
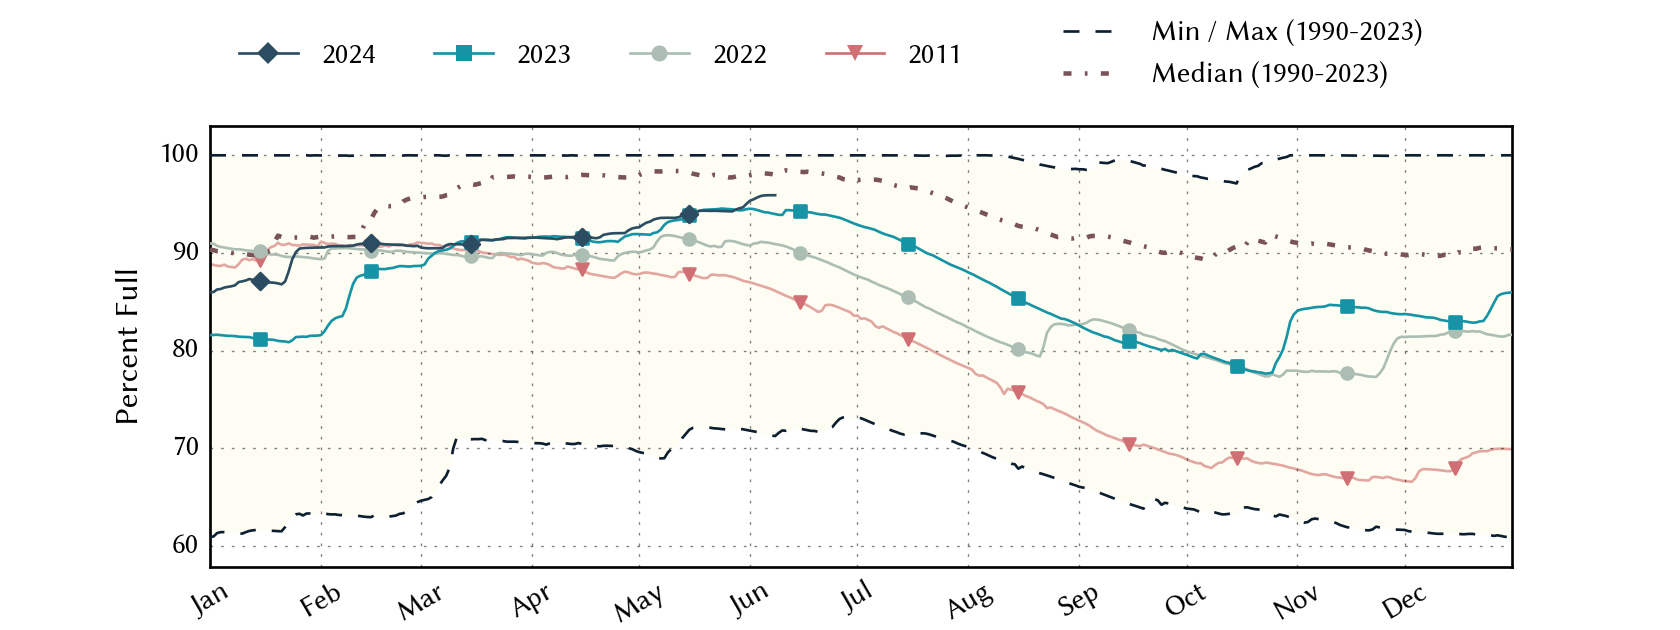
Fort Worth Area Reservoirs: Monitored Water Supply Reservoirs are 93.6% full on 2024-05-12
Historical Data
| Date | Percent Full |
Reservoir Storage (acre-ft) |
Conservation Storage (acre-ft) |
Conservation Capacity (acre-ft) |
|
|---|---|---|---|---|---|
| Today | 2024-05-12 | 93.6 | 2,382,208 | 2,295,051 | 2,451,597 |
| Yesterday | 2024-05-11 | 93.6 | 2,387,476 | 2,294,688 | 2,451,597 |
| 2 days ago | 2024-05-10 | 93.6 | 2,397,447 | 2,294,563 | 2,451,597 |
| 1 week ago | 2024-05-05 | 93.4 | 2,407,517 | 2,289,982 | 2,451,597 |
| 1 month ago | 2024-04-12 | 91.6 | 2,323,070 | 2,246,276 | 2,451,597 |
| 3 months ago | 2024-02-12 | 90.9 | 2,298,197 | 2,229,112 | 2,451,597 |
| 6 months ago | 2023-11-12 | 84.6 | 2,109,725 | 2,074,735 | 2,451,597 |
| 1 year ago | 2023-05-12 | 93.3 | 2,326,872 | 2,288,071 | 2,451,597 |
*
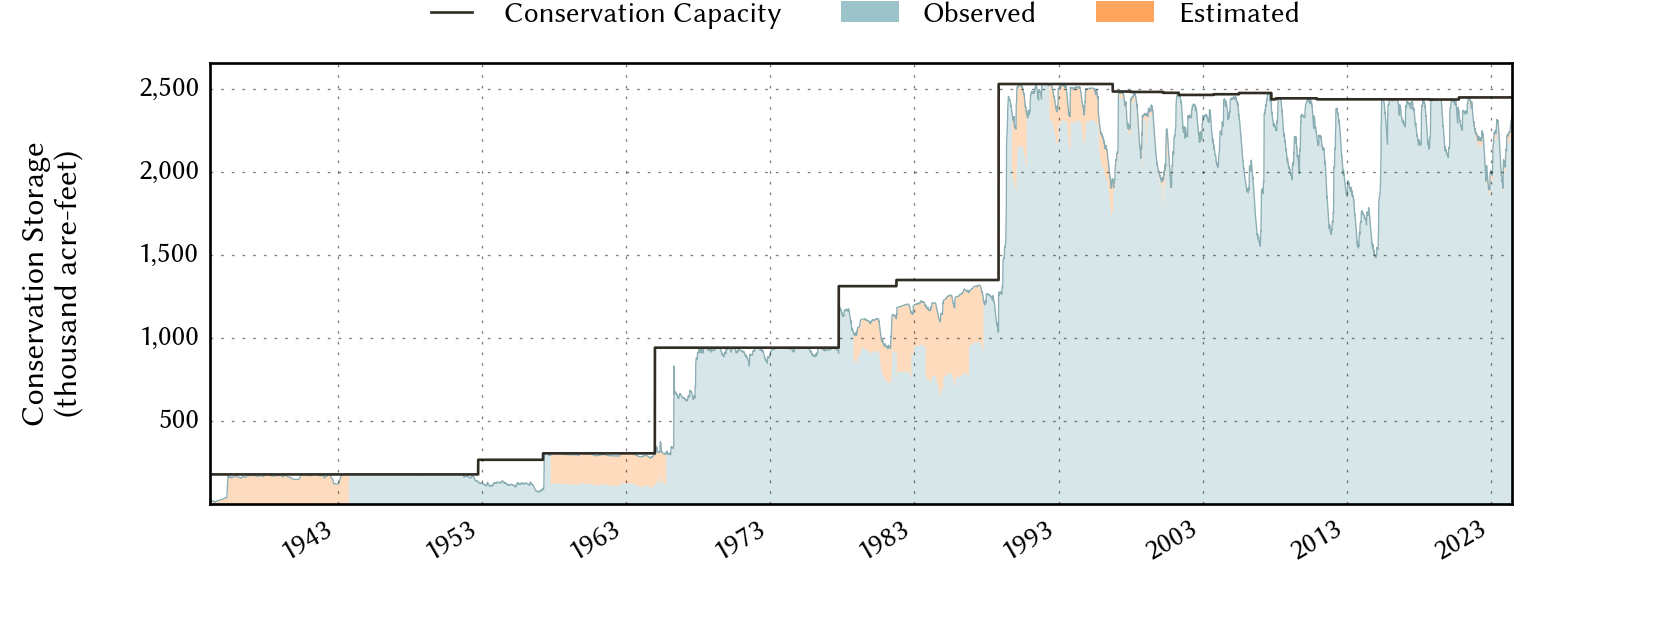
Percent Full is based on Conservation Storage and Conservation Capacity and doesn't account for storage in flood pool.
Area Map

Reservoir Storage
| Reservoir | Percent Full |
Water Level (ft) |
Height Above Conservation Pool (ft) |
Reservoir Storage (acre-ft) |
Conservation Storage (acre-ft) |
Conservation Capacity (acre-ft) |
Surface Area (acres) |
|---|---|---|---|---|---|---|---|
| Arlington | 100.0 | 550.40 | 0.40 | 40,959 | 40,157 | 40,157 | - n.a. - |
| Benbrook | 100.0 | 699.30 | 5.30 | 107,258 | 85,648 | 85,648 | - n.a. - |
| Bridgeport | 61.5 | 822.70 | -13.30 | 228,871 | 228,871 | 372,183 | 9,295 |
| Cedar Creek | 100.0 | 322.02 | 0.02 | 645,440 | 644,686 | 644,686 | - n.a. - |
| Eagle Mountain | 96.3 | 648.35 | -0.75 | 178,246 | 178,246 | 185,087 | 8,997 |
| Richland-Chambers | 100.0 | 315.66 | 0.66 | 1,154,332 | 1,099,417 | 1,099,417 | - n.a. - |
| Worth | 73.8 | 592.07 | -1.93 | 27,102 | 18,026 | 24,419 | 3,195 |