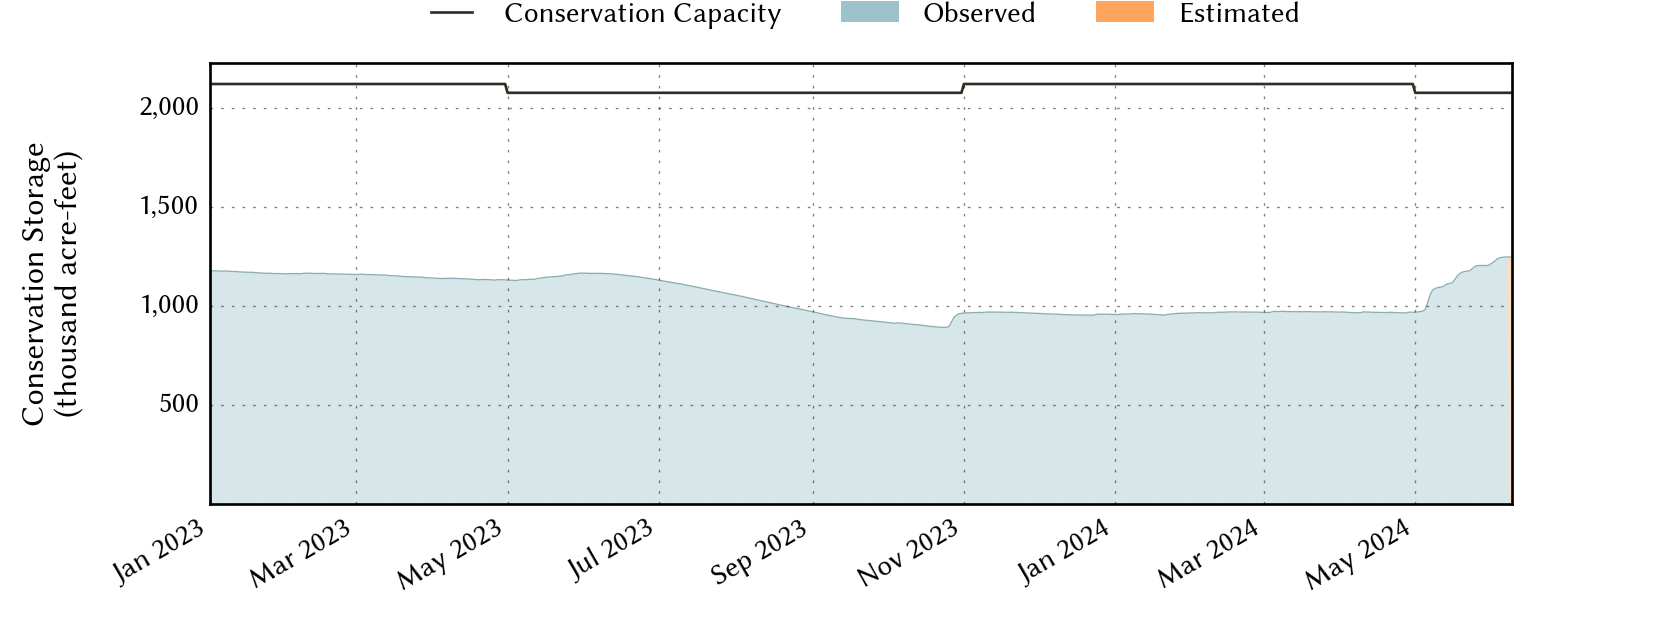
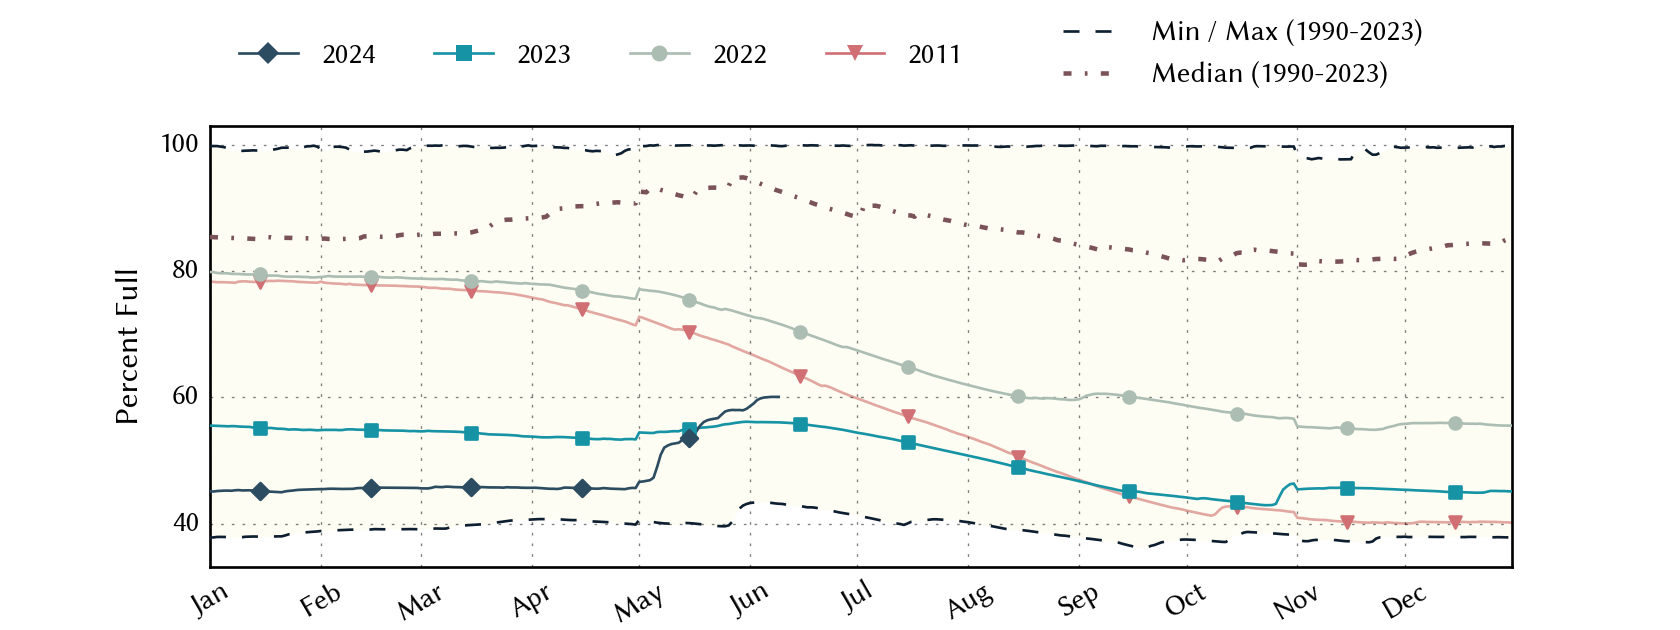
Lower-Colorado Planning Region Reservoirs: Monitored Water Supply Reservoirs are 52.8% full on 2024-05-12
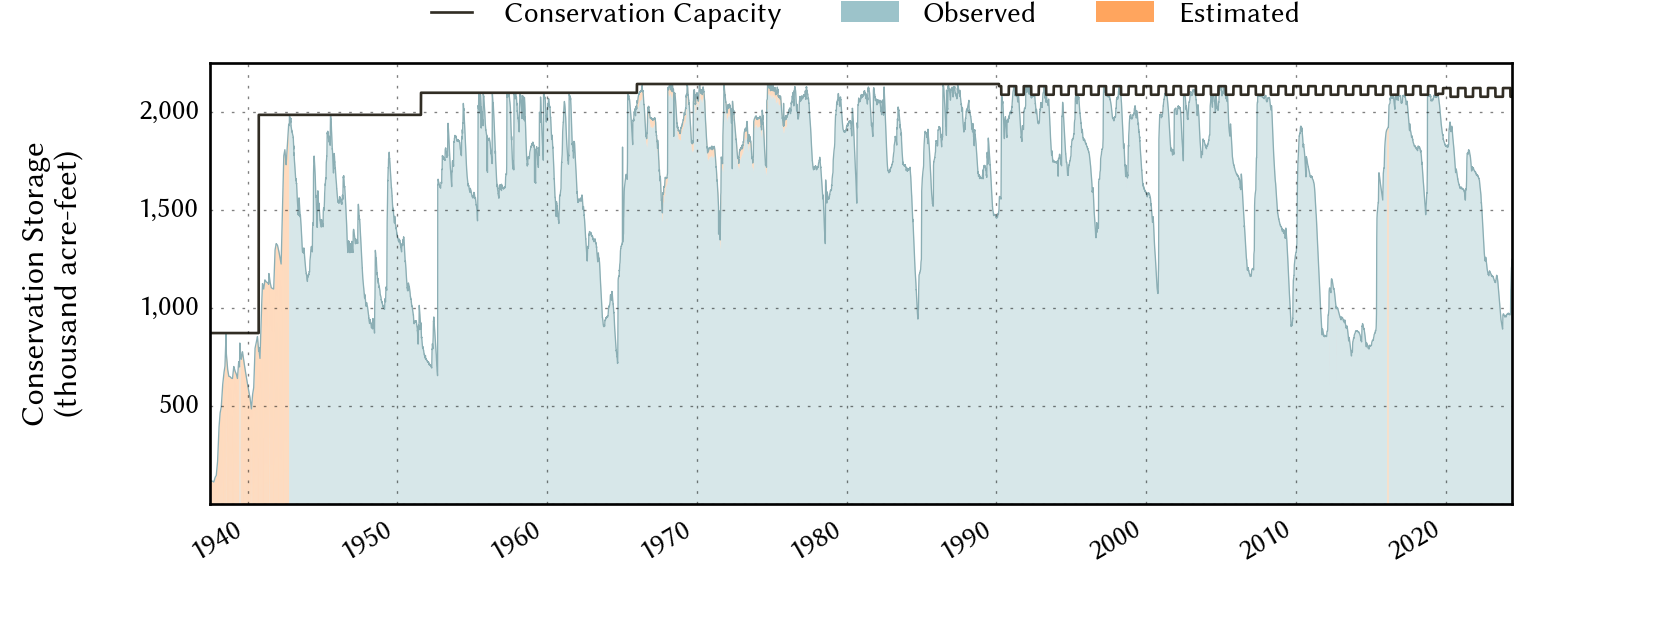
Historical Data
| Date | Percent Full |
Reservoir Storage (acre-ft) |
Conservation Storage (acre-ft) |
Conservation Capacity (acre-ft) |
|
|---|---|---|---|---|---|
| Today | 2024-05-12 | 52.8 | 1,147,580 | 1,097,154 | 2,078,327 |
| Yesterday | 2024-05-11 | 52.7 | 1,146,039 | 1,095,613 | 2,078,327 |
| 2 days ago | 2024-05-10 | 52.6 | 1,144,165 | 1,093,739 | 2,078,327 |
| 1 week ago | 2024-05-05 | 47.3 | 1,033,471 | 983,045 | 2,078,327 |
| 1 month ago | 2024-04-12 | 45.7 | 1,020,539 | 970,113 | 2,122,814 |
| 3 months ago | 2024-02-12 | 45.7 | 1,019,815 | 969,389 | 2,122,814 |
| 6 months ago | 2023-11-12 | 45.7 | 1,020,344 | 969,918 | 2,122,814 |
| 1 year ago | 2023-05-12 | 54.6 | 1,186,039 | 1,135,613 | 2,078,327 |
*
Percent Full is based on Conservation Storage and Conservation Capacity and doesn't account for storage in flood pool.
Area Map

Reservoir Storage
| Reservoir | Percent Full |
Water Level (ft) |
Height Above Conservation Pool (ft) |
Reservoir Storage (acre-ft) |
Conservation Storage (acre-ft) |
Conservation Capacity (acre-ft) |
Surface Area (acres) |
|---|---|---|---|---|---|---|---|
| Austin | 94.9 | 492.02 | -0.78 | 23,366 | 22,757 | 23,972 | 1,535 |
| Buchanan | 62.9 | 1,002.51 | -15.49 | 530,737 | 517,075 | 822,207 | 16,800 |
| Inks | 95.0 | 887.13 | -0.87 | 13,320 | 13,037 | 13,729 | 784 |
| Lyndon B Johnson | 98.5 | 824.73 | -0.27 | 129,885 | 111,045 | 112,778 | 6,406 |
| Marble Falls | 94.8 | 736.35 | -0.65 | 7,203 | 7,203 | 7,597 | 601 |
| Travis | 38.8 | 632.31 | -48.69 | 443,069 | 426,037 | 1,098,044 | 9,498 |