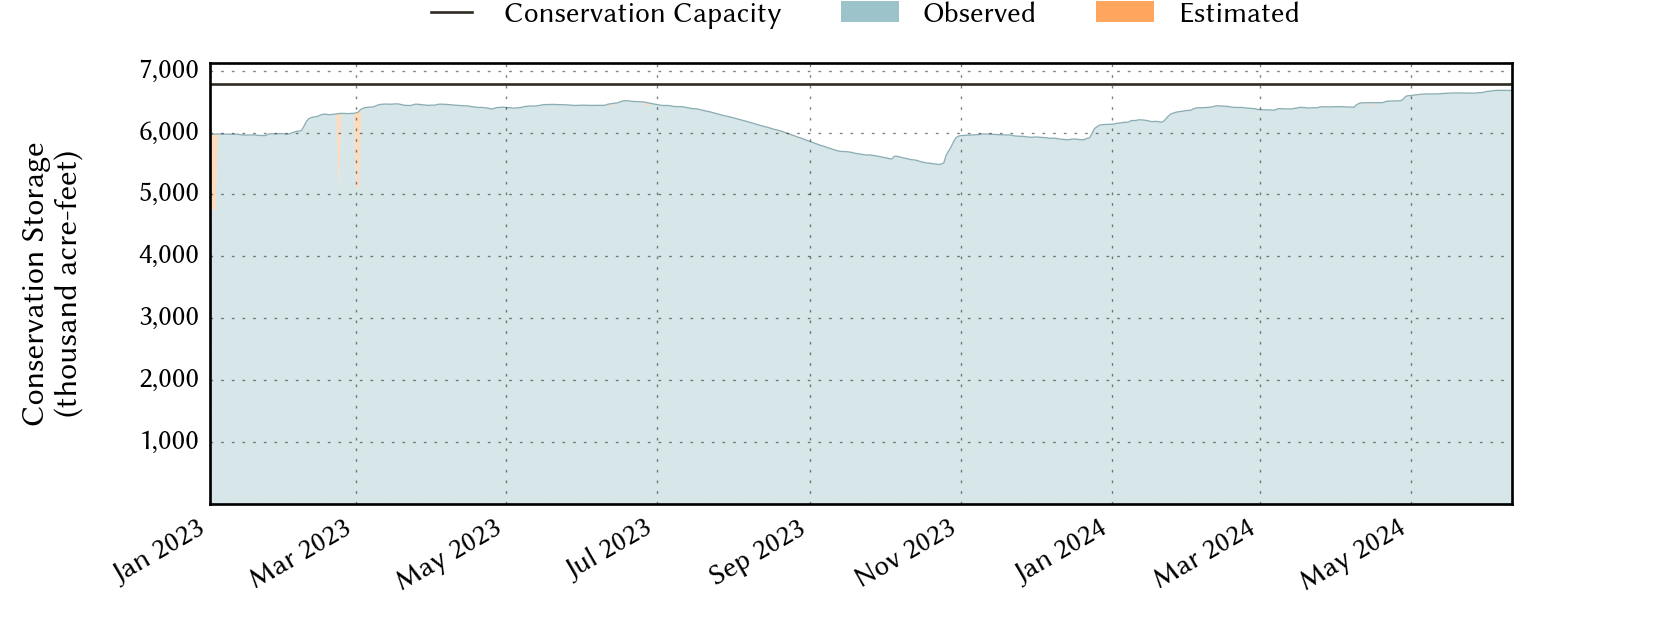
Region-C Planning Region Reservoirs: Monitored Water Supply Reservoirs are 97.7% full on 2024-05-13
Historical Data
| Date | Percent Full |
Reservoir Storage (acre-ft) |
Conservation Storage (acre-ft) |
Conservation Capacity (acre-ft) |
|
|---|---|---|---|---|---|
| Today | 2024-05-13 | 97.7 | 9,020,894 | 6,625,449 | 6,783,467 |
| Yesterday | 2024-05-12 | 97.6 | 8,992,297 | 6,622,890 | 6,783,467 |
| 2 days ago | 2024-05-11 | 97.6 | 9,027,630 | 6,621,545 | 6,783,467 |
| 1 week ago | 2024-05-06 | 97.6 | 9,043,024 | 6,620,516 | 6,783,467 |
| 1 month ago | 2024-04-13 | 95.5 | 7,904,400 | 6,480,684 | 6,783,467 |
| 3 months ago | 2024-02-13 | 94.8 | 7,832,885 | 6,431,155 | 6,783,467 |
| 6 months ago | 2023-11-13 | 88.0 | 7,204,474 | 5,971,860 | 6,783,467 |
| 1 year ago | 2023-05-13 | 94.8 | 7,683,327 | 6,428,017 | 6,783,467 |
*
Percent Full is based on Conservation Storage and Conservation Capacity and doesn't account for storage in flood pool.
Area Map

Reservoir Storage
| Reservoir | Percent Full |
Water Level (ft) |
Height Above Conservation Pool (ft) |
Reservoir Storage (acre-ft) |
Conservation Storage (acre-ft) |
Conservation Capacity (acre-ft) |
Surface Area (acres) |
|---|---|---|---|---|---|---|---|
| Arlington | 100.0 | 550.50 | 0.50 | 41,153 | 40,157 | 40,157 | - n.a. - |
| Bardwell | 100.0 | 435.64 | 14.64 | 107,121 | 43,856 | 43,856 | 5,452 |
| Benbrook | 100.0 | 699.14 | 5.14 | 106,546 | 85,648 | 85,648 | - n.a. - |
| Bois d'Arc | 100.0 | 535.08 | 1.08 | 385,990 | 367,609 | 367,609 | 17,018 |
| Bonham | 100.0 | 565.82 | 0.82 | 11,933 | 11,027 | 11,027 | 1,112 |
| Bridgeport | 62.1 | 822.95 | -13.05 | 231,201 | 231,201 | 372,183 | 9,345 |
| Cedar Creek | 100.0 | 322.13 | 0.13 | 649,046 | 644,686 | 644,686 | - n.a. - |
| Eagle Mountain | 96.9 | 648.47 | -0.63 | 179,328 | 179,328 | 185,087 | 9,037 |
| Grapevine | 100.0 | 543.99 | 8.99 | 232,298 | 163,064 | 163,064 | - n.a. - |
| Halbert | 90.8 | 367.02 | -0.98 | 5,478 | 5,478 | 6,033 | 555 |
| Hubert H Moss | 100.0 | 715.69 | 0.69 | 24,906 | 24,058 | 24,058 | - n.a. - |
| Joe Pool | 100.0 | 527.85 | 5.85 | 193,991 | 149,629 | 149,629 | 8,043 |
| Lavon | 100.0 | 497.28 | 5.28 | 531,566 | 409,757 | 409,757 | 24,612 |
| Lewisville | 100.0 | 525.44 | 3.44 | 695,940 | 563,228 | 563,228 | - n.a. - |
| Lost Creek | 97.6 | 1,008.82 | -0.68 | 11,665 | 11,665 | 11,950 | - n.a. - |
| Mountain Creek | 100.0 | 457.65 | 0.65 | 24,569 | 22,850 | 22,850 | 2,874 |
| Navarro Mills | 100.0 | 436.57 | 12.07 | 120,968 | 49,827 | 49,827 | - n.a. - |
| New Terrell City | 64.5 | 500.12 | -3.88 | 5,544 | 5,533 | 8,583 | 685 |
| Ray Hubbard | 100.0 | 435.59 | 0.09 | 441,450 | 439,559 | 439,559 | 21,061 |
| Ray Roberts | 100.0 | 636.17 | 3.67 | 896,970 | 788,167 | 788,167 | - n.a. - |
| Richland-Chambers | 100.0 | 315.69 | 0.69 | 1,155,663 | 1,099,417 | 1,099,417 | - n.a. - |
| Texoma 1 | 100.0 | 621.98 | 4.98 | 2,911,552 | 1,243,801 | 1,243,801 | 93,695 |
| Waxahachie | 100.0 | 532.17 | 0.67 | 12,096 | 11,060 | 11,060 | 691 |
| Weatherford | 93.7 | 894.95 | -1.05 | 16,690 | 16,690 | 17,812 | 1,048 |
| Worth | 74.3 | 592.11 | -1.89 | 27,230 | 18,154 | 24,419 | 3,200 |
footnotes
1
Lake Texoma straddles the border of Texas and Oklahoma, Texas has rights to 50% of Lake Texoma's total conservation capacity. Percent full, conservation storage and conservation capacity are based on the Texas share.