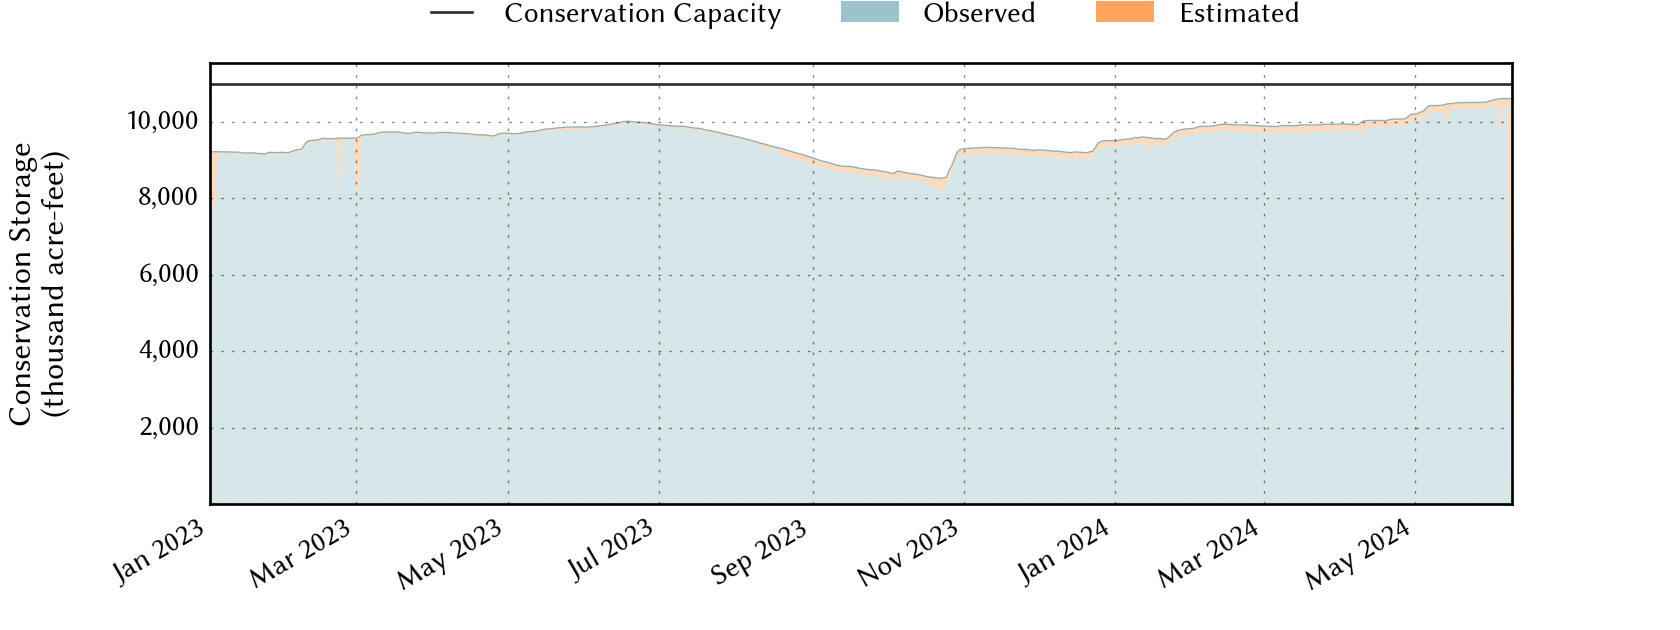
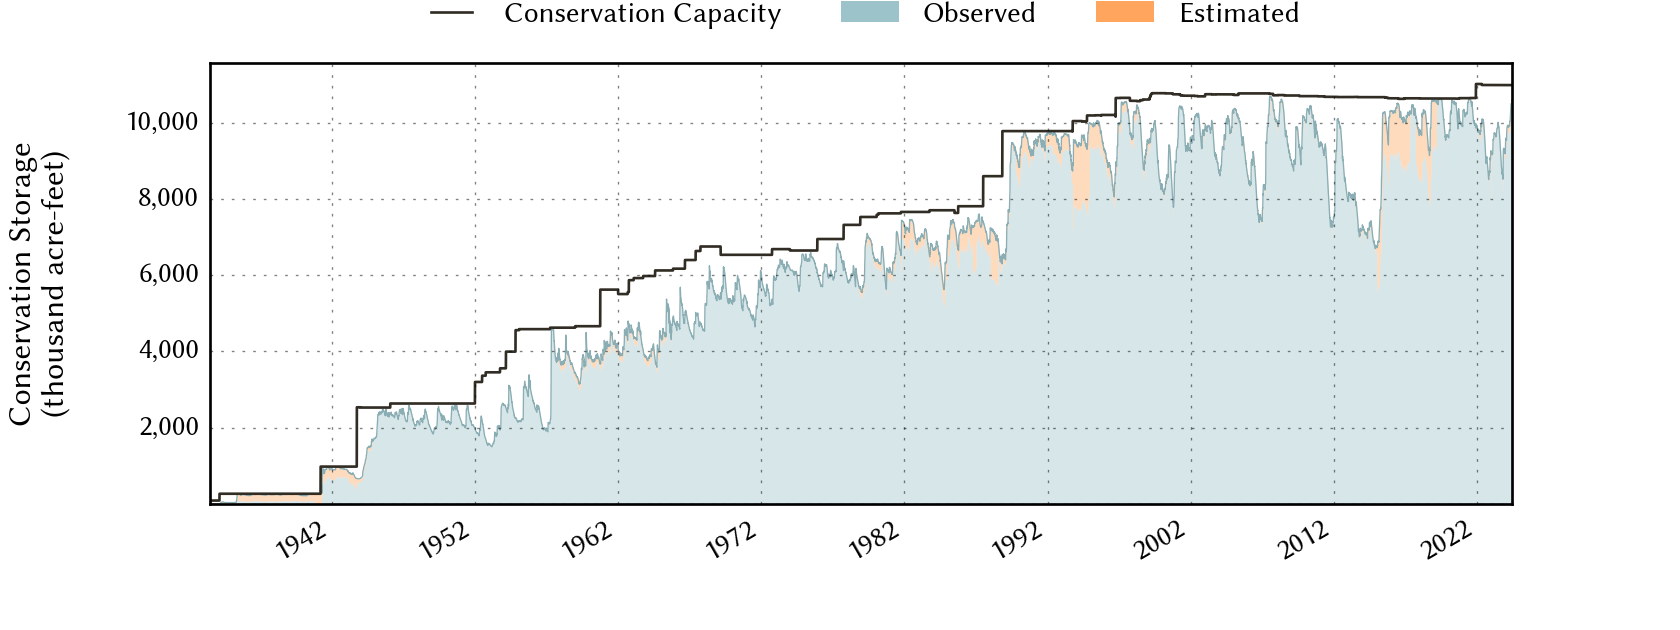
North-Central Climate Division Reservoirs: Monitored Water Supply Reservoirs are 94.9% full on 2024-05-12
Historical Data
| Date | Percent Full |
Reservoir Storage (acre-ft) |
Conservation Storage (acre-ft) |
Conservation Capacity (acre-ft) |
|
|---|---|---|---|---|---|
| Today | 2024-05-12 | 94.9 | 13,547,359 | 10,422,692 | 10,984,350 |
| Yesterday | 2024-05-11 | 94.9 | 13,602,639 | 10,422,205 | 10,984,350 |
| 2 days ago | 2024-05-10 | 94.9 | 13,671,053 | 10,419,572 | 10,984,350 |
| 1 week ago | 2024-05-05 | 93.9 | 13,052,723 | 10,314,361 | 10,984,350 |
| 1 month ago | 2024-04-12 | 91.3 | 11,631,380 | 10,030,373 | 10,984,350 |
| 3 months ago | 2024-02-12 | 90.3 | 11,507,365 | 9,915,588 | 10,984,350 |
| 6 months ago | 2023-11-12 | 84.8 | 10,603,447 | 9,314,993 | 10,984,350 |
| 1 year ago | 2023-05-12 | 88.7 | 11,065,110 | 9,744,298 | 10,984,350 |
*
Percent Full is based on Conservation Storage and Conservation Capacity and doesn't account for storage in flood pool.
Area Map

Reservoir Storage
| Reservoir | Percent Full |
Water Level (ft) |
Height Above Conservation Pool (ft) |
Reservoir Storage (acre-ft) |
Conservation Storage (acre-ft) |
Conservation Capacity (acre-ft) |
Surface Area (acres) |
|---|---|---|---|---|---|---|---|
| Amon G Carter | 100.0 | 921.18 | 1.18 | 21,931 | 19,266 | 19,266 | 1,570 |
| Aquilla | 100.0 | 546.10 | 8.60 | 74,245 | 43,243 | 43,243 | - n.a. - |
| Arlington | 100.0 | 550.40 | 0.40 | 40,959 | 40,157 | 40,157 | - n.a. - |
| Arrowhead | 64.5 | 919.64 | -6.36 | 148,534 | 148,534 | 230,359 | 11,226 |
| Bardwell | 100.0 | 435.49 | 14.49 | 106,305 | 43,856 | 43,856 | 5,429 |
| Belton | 100.0 | 604.37 | 10.37 | 575,789 | 432,631 | 432,631 | - n.a. - |
| Benbrook | 100.0 | 699.30 | 5.30 | 107,258 | 85,648 | 85,648 | - n.a. - |
| Bois d'Arc | 100.0 | 534.62 | 0.62 | 378,161 | 367,609 | 367,609 | 16,809 |
| Bonham | 100.0 | 565.34 | 0.34 | 11,405 | 11,027 | 11,027 | 1,088 |
| Bridgeport | 61.5 | 822.70 | -13.30 | 228,871 | 228,871 | 372,183 | 9,295 |
| Brownwood | 73.0 | 1,419.22 | -5.38 | 95,581 | 95,581 | 130,868 | 5,625 |
| Cisco | 60.8 | 1,510.79 | -11.67 | 17,644 | 17,644 | 29,003 | 758 |
| Crook | 99.9 | 475.99 | -0.01 | 9,200 | 9,185 | 9,195 | 1,058 |
| Eagle Mountain | 96.3 | 648.35 | -0.75 | 178,246 | 178,246 | 185,087 | 8,997 |
| Georgetown | 83.5 | 785.95 | -5.05 | 31,811 | 31,748 | 38,005 | 1,173 |
| Graham | 77.6 | 1,070.64 | -4.36 | 35,172 | 35,158 | 45,288 | 2,145 |
| Granbury | 98.6 | 692.47 | -0.23 | 131,988 | 131,079 | 132,949 | 8,088 |
| Granger | 100.0 | 509.34 | 5.34 | 76,870 | 51,822 | 51,822 | - n.a. - |
| Grapevine | 100.0 | 543.76 | 8.76 | 230,279 | 163,064 | 163,064 | - n.a. - |
| Halbert | 90.3 | 366.97 | -1.03 | 5,450 | 5,450 | 6,033 | 554 |
| Hubbard Creek | 50.6 | 1,171.19 | -12.12 | 163,494 | 158,618 | 313,298 | 10,042 |
| Hubert H Moss | 100.0 | 715.21 | 0.21 | 24,382 | 24,058 | 24,058 | - n.a. - |
| Jim Chapman | 100.0 | 440.37 | 0.37 | 301,196 | 258,723 | 258,723 | 18,211 |
| Joe Pool | 100.0 | 527.99 | 5.99 | 195,119 | 149,629 | 149,629 | 8,075 |
| Kickapoo | 66.1 | 1,039.40 | -5.60 | 57,071 | 57,071 | 86,345 | 4,591 |
| Lavon | 100.0 | 497.14 | 5.14 | 528,127 | 409,757 | 409,757 | 24,520 |
| Leon | 47.5 | 1,364.48 | -10.52 | 13,459 | 13,179 | 27,762 | 1,079 |
| Lewisville | 100.0 | 525.15 | 3.15 | 687,441 | 563,228 | 563,228 | - n.a. - |
| Limestone | 99.9 | 362.99 | -0.01 | 203,656 | 203,656 | 203,780 | 12,475 |
| Lost Creek | 96.8 | 1,008.60 | -0.90 | 11,572 | 11,572 | 11,950 | - n.a. - |
| Mineral Wells | 100.0 | 863.35 | 0.35 | 5,438 | 5,273 | 5,273 | 476 |
| Mountain Creek | 100.0 | 457.40 | 0.40 | 23,824 | 22,850 | 22,850 | 2,793 |
| Navarro Mills | 100.0 | 436.43 | 11.93 | 119,979 | 49,827 | 49,827 | - n.a. - |
| New Terrell City | 65.4 | 500.24 | -3.76 | 5,628 | 5,617 | 8,583 | 690 |
| Nocona | 84.7 | 824.96 | -2.54 | 18,459 | 18,155 | 21,444 | 1,249 |
| Palo Pinto | 52.5 | 860.53 | -6.47 | 14,432 | 14,046 | 26,766 | 1,635 |
| Pat Cleburne | 100.0 | 734.17 | 0.67 | 27,064 | 26,008 | 26,008 | - n.a. - |
| Pat Mayse | 100.0 | 453.55 | 2.55 | 132,572 | 113,683 | 113,683 | - n.a. - |
| Possum Kingdom | 98.4 | 998.53 | -0.47 | 529,771 | 529,771 | 538,139 | 17,695 |
| Proctor | 44.8 | 1,153.48 | -8.52 | 24,548 | 24,548 | 54,762 | 2,433 |
| Ray Hubbard | 100.0 | 435.51 | 0.01 | 439,769 | 439,559 | 439,559 | 20,960 |
| Ray Roberts | 100.0 | 635.37 | 2.87 | 872,575 | 788,167 | 788,167 | - n.a. - |
| Richland-Chambers | 100.0 | 315.66 | 0.66 | 1,154,332 | 1,099,417 | 1,099,417 | - n.a. - |
| Squaw Creek | 100.0 | 775.78 | 0.78 | 153,756 | 151,250 | 151,250 | - n.a. - |
| Stillhouse Hollow | 100.0 | 623.94 | 1.94 | 242,627 | 229,796 | 229,796 | - n.a. - |
| Tawakoni | 100.0 | 438.95 | 1.45 | 926,444 | 871,685 | 871,685 | - n.a. - |
| Texoma 1 | 100.0 | 622.26 | 5.26 | 2,938,055 | 1,243,801 | 1,243,801 | 94,313 |
| Waco | 100.0 | 480.38 | 18.18 | 368,394 | 189,418 | 189,418 | - n.a. - |
| Waxahachie | 100.0 | 532.14 | 0.64 | 12,075 | 11,060 | 11,060 | 690 |
| Weatherford | 93.3 | 894.88 | -1.12 | 16,617 | 16,617 | 17,812 | 1,046 |
| Whitney | 100.0 | 541.69 | 8.69 | 802,682 | 564,808 | 564,808 | - n.a. - |
| Worth | 73.8 | 592.07 | -1.93 | 27,102 | 18,026 | 24,419 | 3,195 |
footnotes
1
Lake Texoma straddles the border of Texas and Oklahoma, Texas has rights to 50% of Lake Texoma's total conservation capacity. Percent full, conservation storage and conservation capacity are based on the Texas share.