Reservoir Storage Summary for Climate Divisions on 2024-07-27
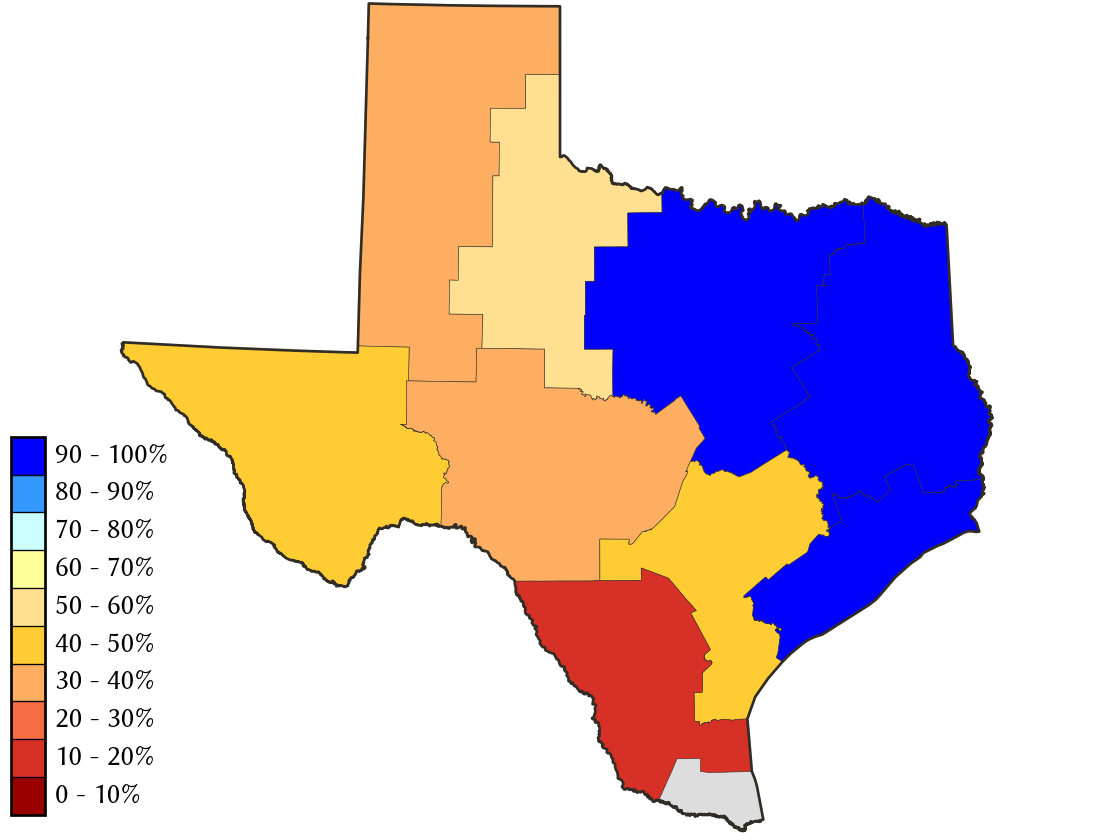
Percent Full
| Today | Yesterday | 2 days ago | 1 week ago | 1 month ago | 3 months ago | 6 months ago | 1 year ago | |
|---|---|---|---|---|---|---|---|---|
| 2024-07-27 | 2024-07-26 | 2024-07-25 | 2024-07-20 | 2024-06-27 | 2024-04-27 | 2024-01-27 | 2023-07-27 | |
| East Texas | 99.0 | 99.0 | 98.7 | 98.1 | 99.7 | 96.3 | 92.6 | 93.4 |
| Edwards Plateau | 34.5 | 34.5 | 34.6 | 34.2 | 35.5 | 31.1 | 30.1 | 38.1 |
| High Plains | 34.3 | 34.3 | 34.4 | 34.5 | 35.2 | 36.4 | 37.1 | 40.2 |
| Low Rolling Plains | 63.9 | 63.9 | 64.0 | 64.2 | 65.4 | 53.7 | 52.2 | 57.1 |
| North Central | 95.4 | 95.4 | 95.4 | 95.4 | 96.3 | 91.7 | 89.0 | 88.1 |
| South | 18.3 | 18.3 | 18.2 | 18.2 | 18.0 | 17.8 | 22.2 | 22.9 |
| South Central | 48.8 | 48.8 | 48.1 | 44.4 | 45.0 | 43.4 | 43.7 | 48.0 |
| Trans Pecos | 39.1 | 39.1 | 39.2 | 39.0 | 39.7 | 41.4 | 41.4 | 49.7 |
| Upper Coast | 99.7 | 99.8 | 99.8 | 99.8 | 97.7 | 97.7 | 100.0 | 91.4 |
*
Percent Full is based on Conservation Storage and Conservation Capacity.
Recent Conditions
| Percent Full |
Reservoir Storage (acre-ft) |
Conservation Storage (acre-ft) |
Conservation Capacity (acre-ft) |
|
|---|---|---|---|---|
| East Texas | 99.0 | 12,916,088 | 9,923,503 | 10,023,049 |
| Edwards Plateau | 34.5 | 1,670,290 | 1,456,731 | 4,217,160 |
| High Plains | 34.3 | 259,075 | 218,695 | 637,396 |
| Low Rolling Plains | 63.9 | 616,393 | 577,852 | 903,870 |
| North Central | 95.4 | 12,249,127 | 10,477,890 | 10,984,350 |
| South | 18.3 | 564,882 | 454,395 | 2,481,249 |
| South Central | 48.8 | 989,074 | 944,661 | 1,936,953 |
| Trans Pecos | 39.1 | 59,061 | 59,061 | 151,110 |
| Upper Coast | 99.7 | 323,523 | 290,369 | 291,293 |
**
The Lower Valley climate division has no contributing Reservoirs present.