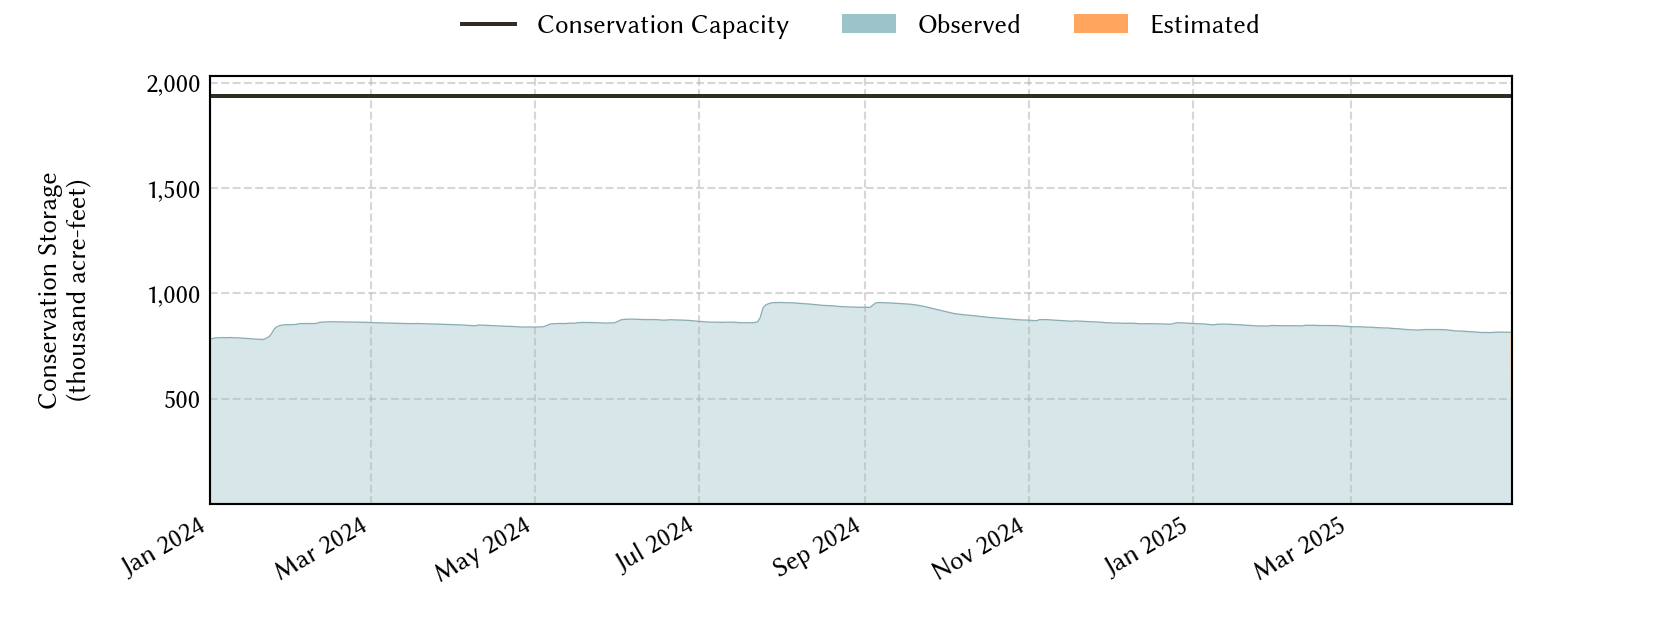
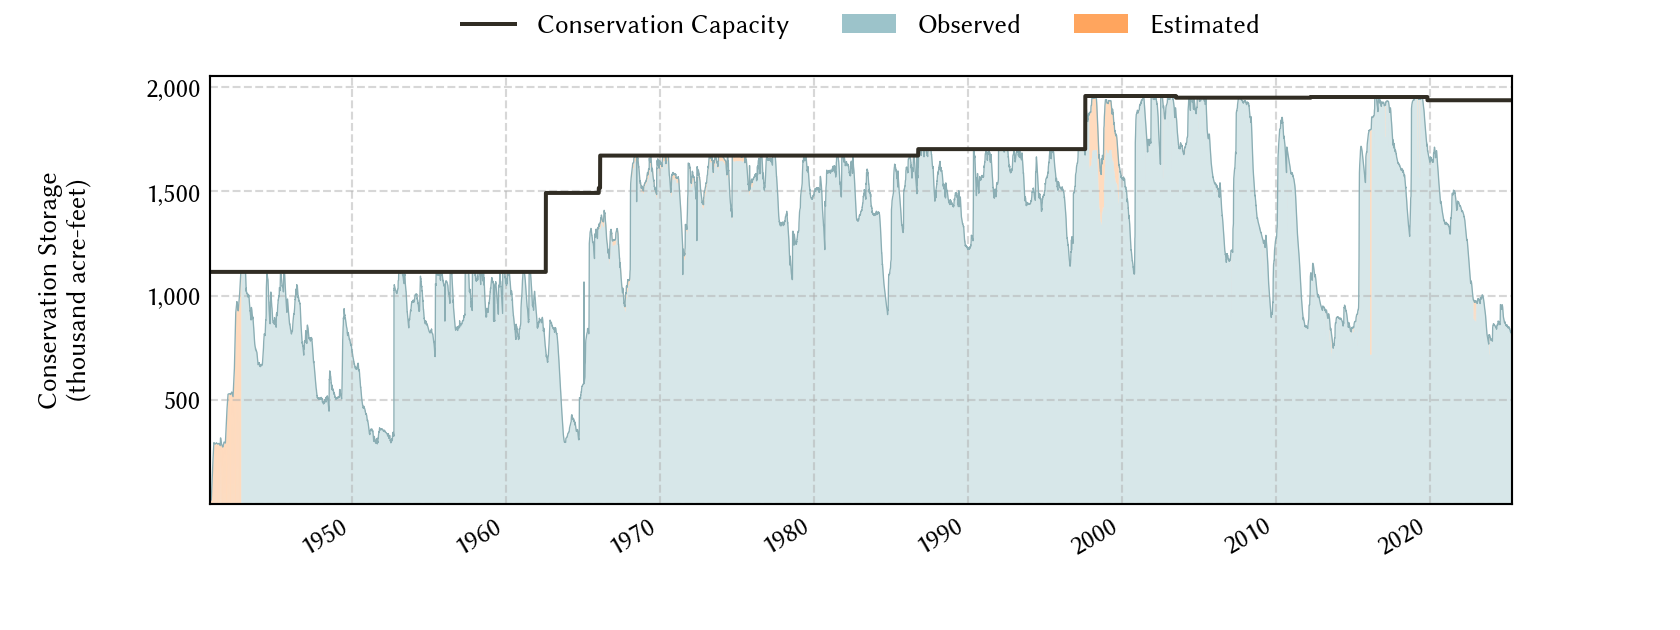
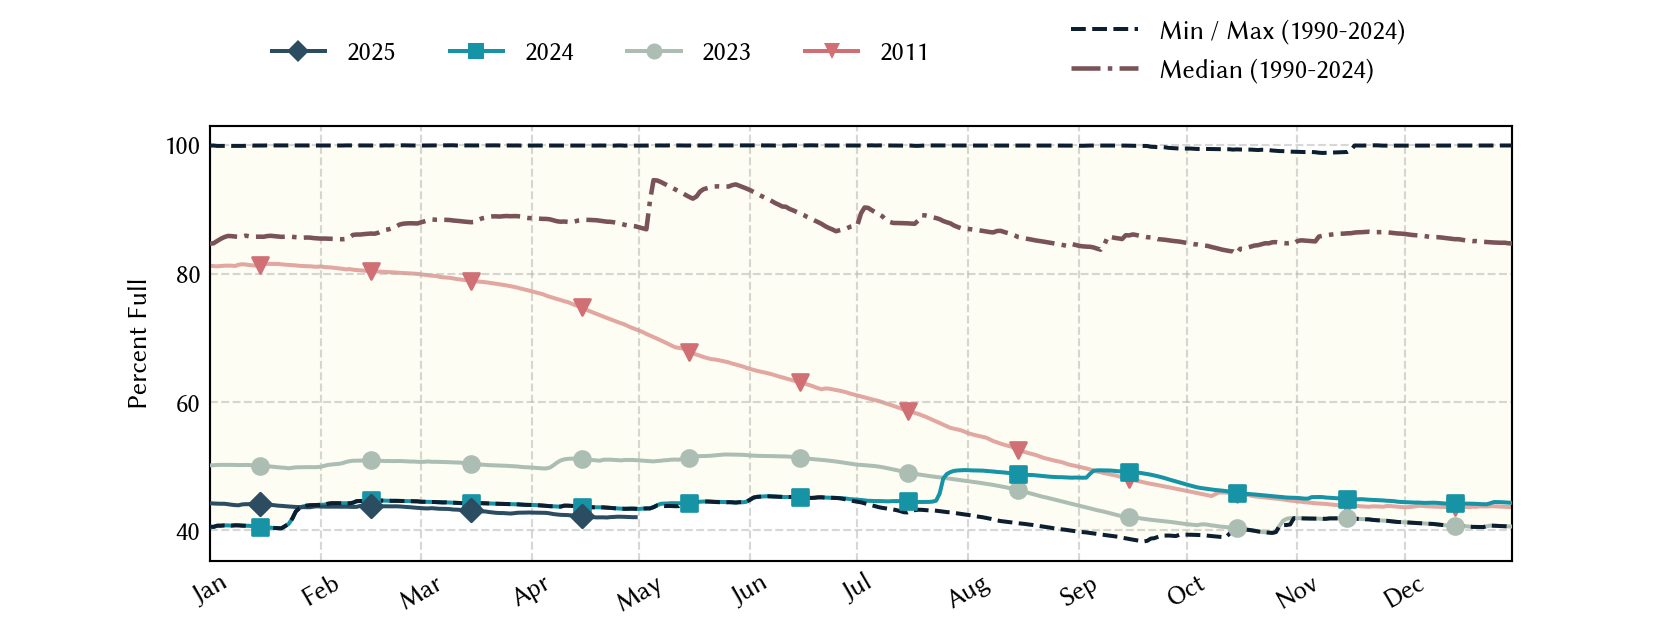
South-Central Climate Division Reservoirs: Monitored Water Supply Reservoirs are 90.0% full on 2026-07-21
Historical Data
| Date | Percent Full |
Reservoir Storage (acre-ft) |
Conservation Storage (acre-ft) |
Conservation Capacity (acre-ft) |
|
|---|---|---|---|---|---|
| Today | 2026-07-21 | 90.0 | 1,849,006 | 1,743,769 | 1,936,953 |
| Yesterday | 2026-07-20 | 90.0 | 1,849,063 | 1,743,205 | 1,936,953 |
| 2 days ago | 2026-07-19 | 89.7 | 1,857,526 | 1,738,321 | 1,936,953 |
| 1 week ago | 2026-07-14 | 71.2 | 1,412,140 | 1,378,542 | 1,936,953 |
| 1 month ago | 2026-06-21 | 72.2 | 1,449,073 | 1,398,034 | 1,936,953 |
| 3 months ago | 2026-04-21 | 61.4 | 1,207,607 | 1,189,895 | 1,936,953 |
| 6 months ago | 2026-01-21 | 65.0 | 1,277,554 | 1,259,842 | 1,936,953 |
| 1 year ago | 2025-07-21 | 75.7 | 1,490,189 | 1,466,757 | 1,936,953 |
*
Percent Full is based on Conservation Storage and Conservation Capacity and doesn't account for storage in flood pool.
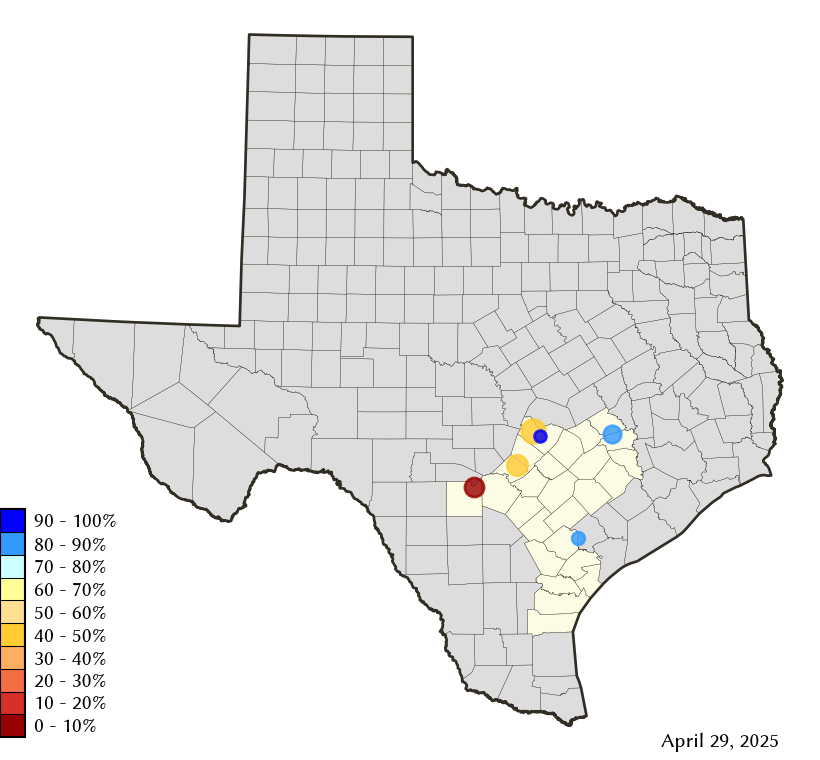
Area Map
Reservoir Storage
| Reservoir | Type | Percent Full |
Water Level (ft) |
Height Above Conservation Pool (ft) |
Reservoir Storage (acre-ft) |
Conservation Storage (acre-ft) |
Conservation Capacity (acre-ft) |
Surface Area (acres) |
|---|---|---|---|---|---|---|---|---|
| Austin |

|
97.8 | 492.47 | -0.33 | 24,063 | 23,454 | 23,972 | 1,561 |
| Canyon |

|
99.4 | 908.73 | -0.27 | 376,633 | 376,562 | 378,781 | 8,205 |
| Coleto Creek |
|
83.2 | 95.81 | -2.19 | 25,817 | 25,817 | 31,040 | 2,343 |
| Medina |
|
27.4 | 1,019.34 | -44.86 | 69,895 | 69,895 | 254,823 | 2,359 |
| Somerville |
|
100.0 | 240.29 | 2.29 | 177,365 | 150,293 | 150,293 | - n.a. - |
| Travis |
|
100.0 | 683.77 | 2.77 | 1,168,785 | 1,098,044 | 1,098,044 | 19,786 |