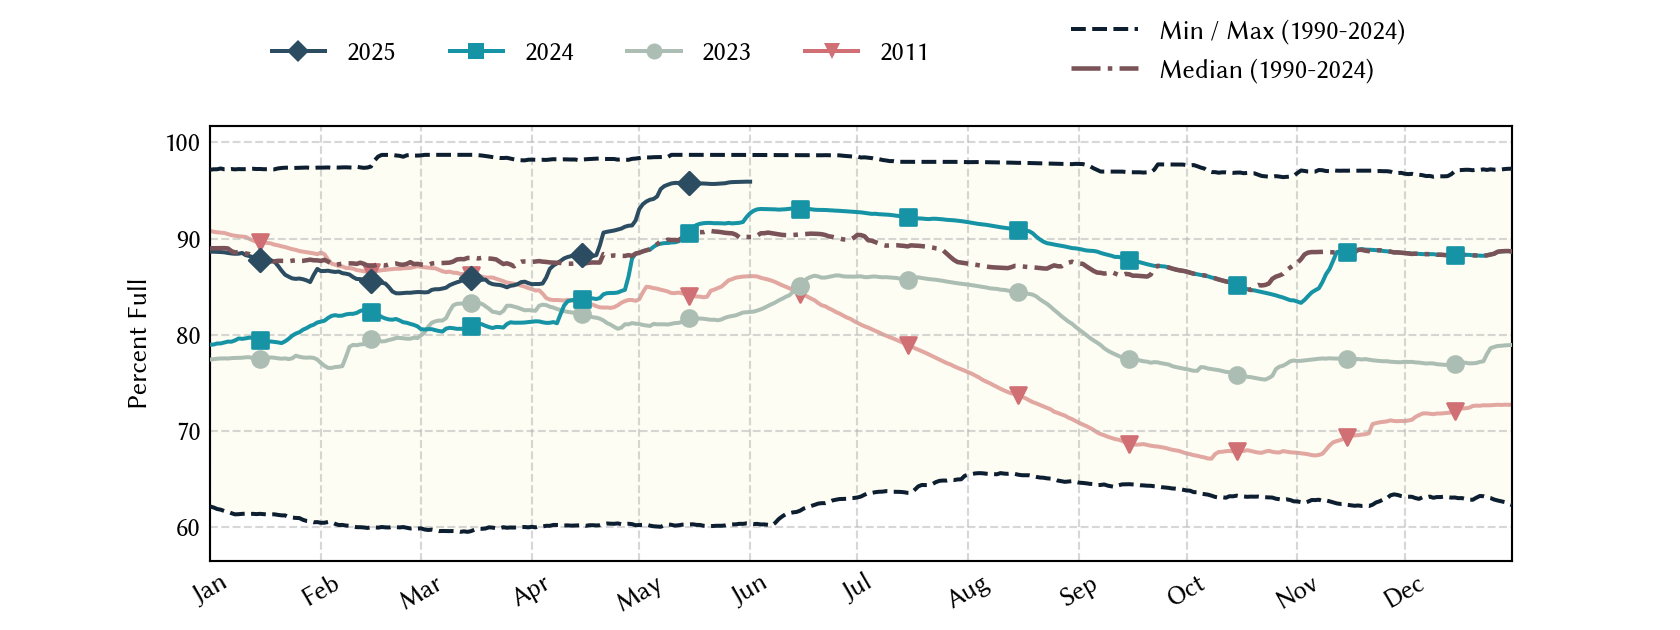
Red River Basin Reservoirs: Monitored Water Supply Reservoirs are 93.8% full on 2026-06-25
Historical Data
| Date | Percent Full |
Reservoir Storage (acre-ft) |
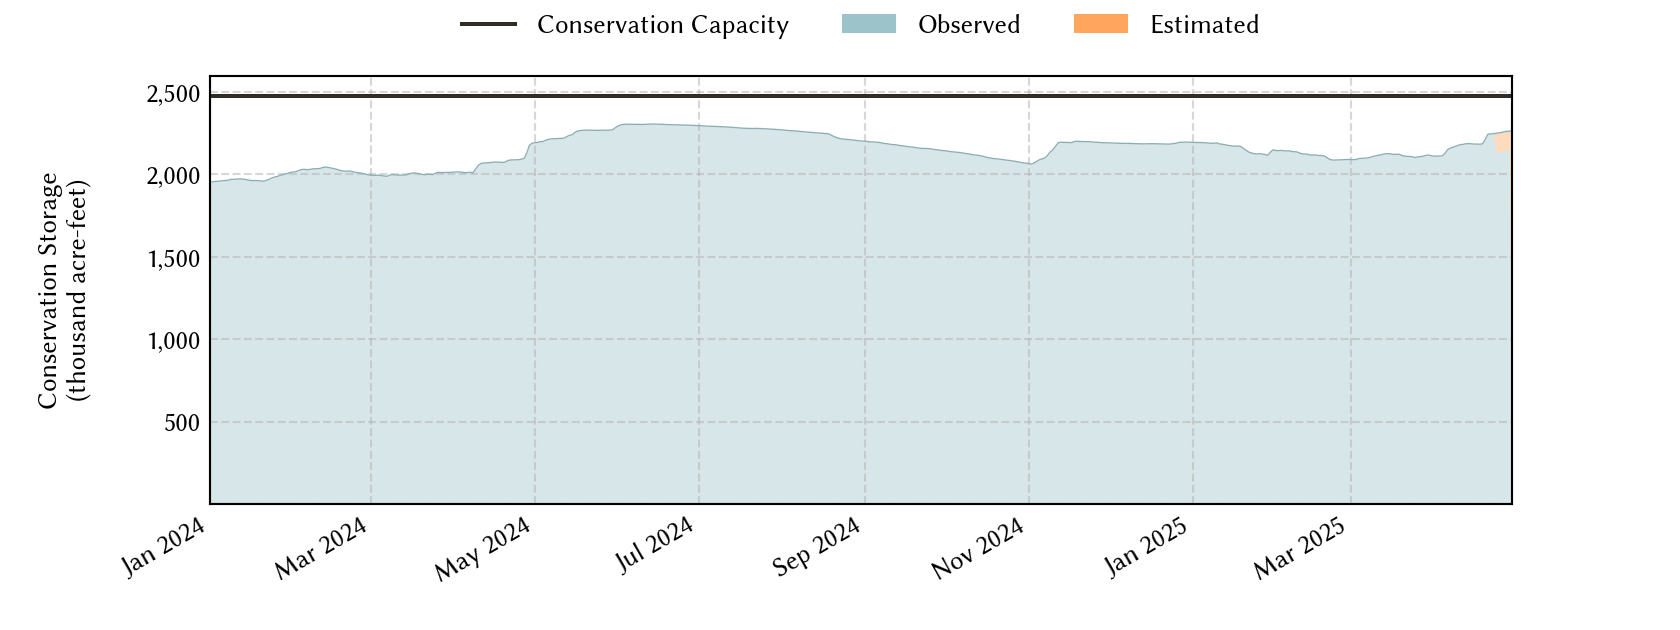
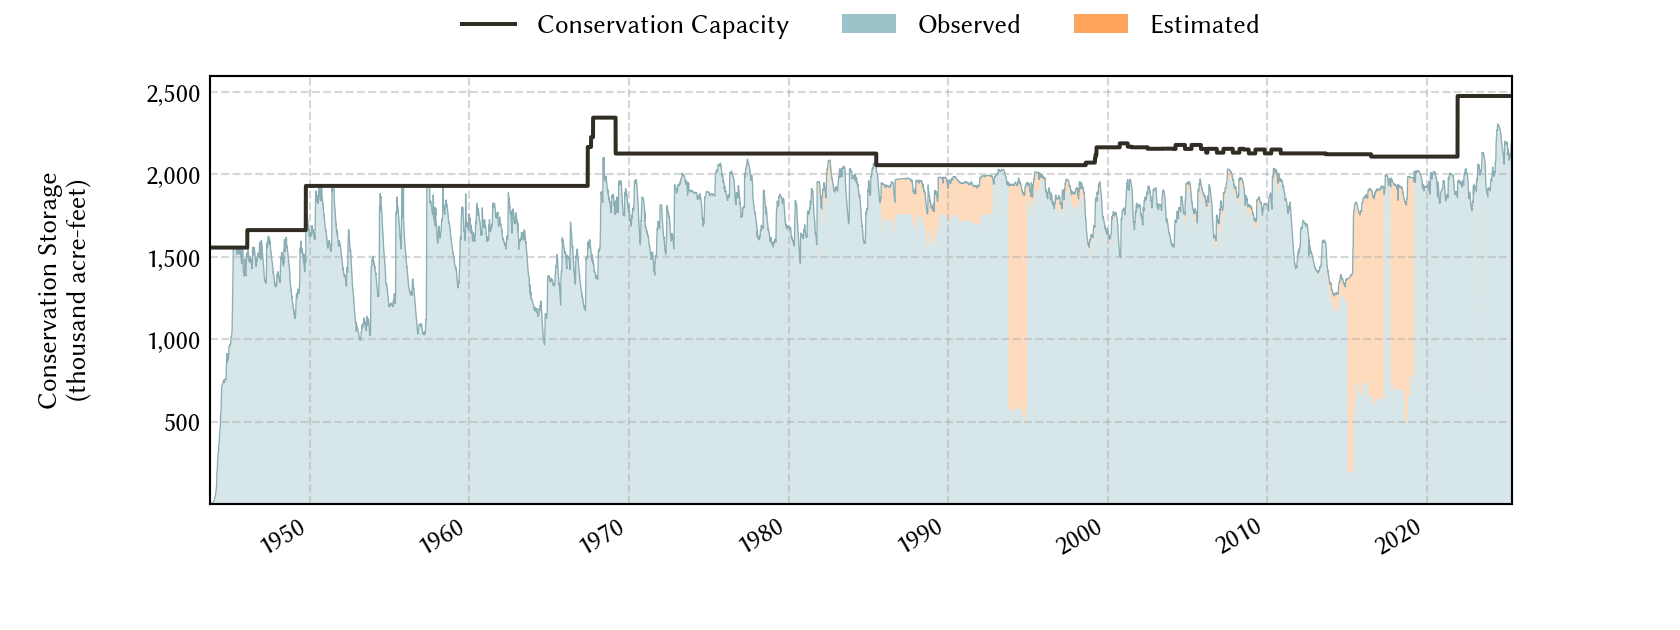
Conservation Storage (acre-ft) |
Conservation Capacity (acre-ft) |
|
|---|---|---|---|---|---|
| Today | 2026-06-25 | 93.8 | 3,768,881 | 2,321,821 | 2,474,646 |
| Yesterday | 2026-06-24 | 93.8 | 3,758,761 | 2,321,082 | 2,474,646 |
| 2 days ago | 2026-06-23 | 93.8 | 3,751,355 | 2,321,065 | 2,474,646 |
| 1 week ago | 2026-06-18 | 93.8 | 3,728,477 | 2,322,210 | 2,474,646 |
| 1 month ago | 2026-05-25 | 91.2 | 3,595,109 | 2,258,073 | 2,474,646 |
| 3 months ago | 2026-03-25 | 90.2 | 3,468,488 | 2,232,201 | 2,474,646 |
| 6 months ago | 2025-12-25 | 91.2 | 3,499,313 | 2,257,813 | 2,474,646 |
| 1 year ago | 2025-06-25 | 96.1 | 4,079,845 | 2,376,980 | 2,474,646 |
*
Percent Full is based on Conservation Storage and Conservation Capacity and doesn't account for storage in flood pool.
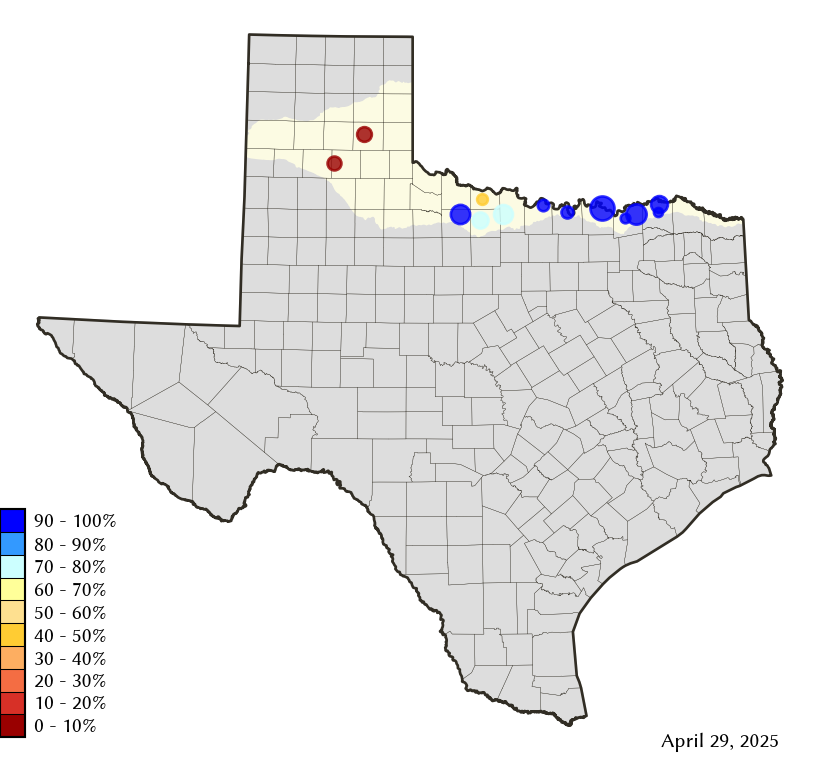
Area Map
Reservoir Storage
| Reservoir | Type | Percent Full |
Water Level (ft) |
Height Above Conservation Pool (ft) |
Reservoir Storage (acre-ft) |
Conservation Storage (acre-ft) |
Conservation Capacity (acre-ft) |
Surface Area (acres) |
|---|---|---|---|---|---|---|---|---|
| Arrowhead |

|
83.3 | 923.21 | -2.79 | 191,895 | 191,895 | 230,359 | 13,067 |
| Bois d'Arc |
|
100.0 | 534.94 | 0.94 | 383,607 | 367,609 | 367,609 | 16,955 |
| Bonham |
|
100.0 | 565.41 | 0.41 | 11,481 | 11,027 | 11,027 | 1,091 |
| Crook |
|
100.0 | 476.59 | 0.59 | 9,835 | 9,195 | 9,195 | - n.a. - |
| Greenbelt |
|
6.1 | 2,610.10 | -53.90 | 4,116 | 3,684 | 59,968 | 325 |
| Hubert H Moss |
|
99.6 | 714.92 | -0.08 | 24,068 | 23,971 | 24,058 | 1,090 |
| Kemp |

|
98.0 | 1,143.67 | -0.33 | 240,410 | 240,284 | 245,307 | 15,140 |
| Kickapoo |
|
90.4 | 1,043.54 | -1.46 | 78,026 | 78,026 | 86,345 | 5,532 |
| Mackenzie |
|
11.9 | 3,020.72 | -79.28 | 5,544 | 5,544 | 46,450 | 250 |
| Nocona |
|
84.8 | 824.98 | -2.52 | 18,484 | 18,180 | 21,444 | 1,249 |
| North Fork Buffalo Creek |
|
96.9 | 1,047.67 | -0.33 | 14,922 | 14,922 | 15,400 | 1,475 |
| Pat Mayse |
|
100.0 | 455.31 | 4.31 | 143,146 | 113,683 | 113,683 | - n.a. - |
| Texoma 1 |
|
100.0 | 618.99 | 1.99 | 2,643,347 | 1,243,801 | 1,243,801 | 85,519 |
footnotes
1
Lake Texoma straddles the border of Texas and Oklahoma, Texas has rights to 50% of Lake Texoma's total conservation capacity. Percent full, conservation storage and conservation capacity are based on the Texas share.