Low-Rolling-Plains Climate Division Reservoirs: Monitored Water Supply Reservoirs are 58.3% full on 2026-07-29
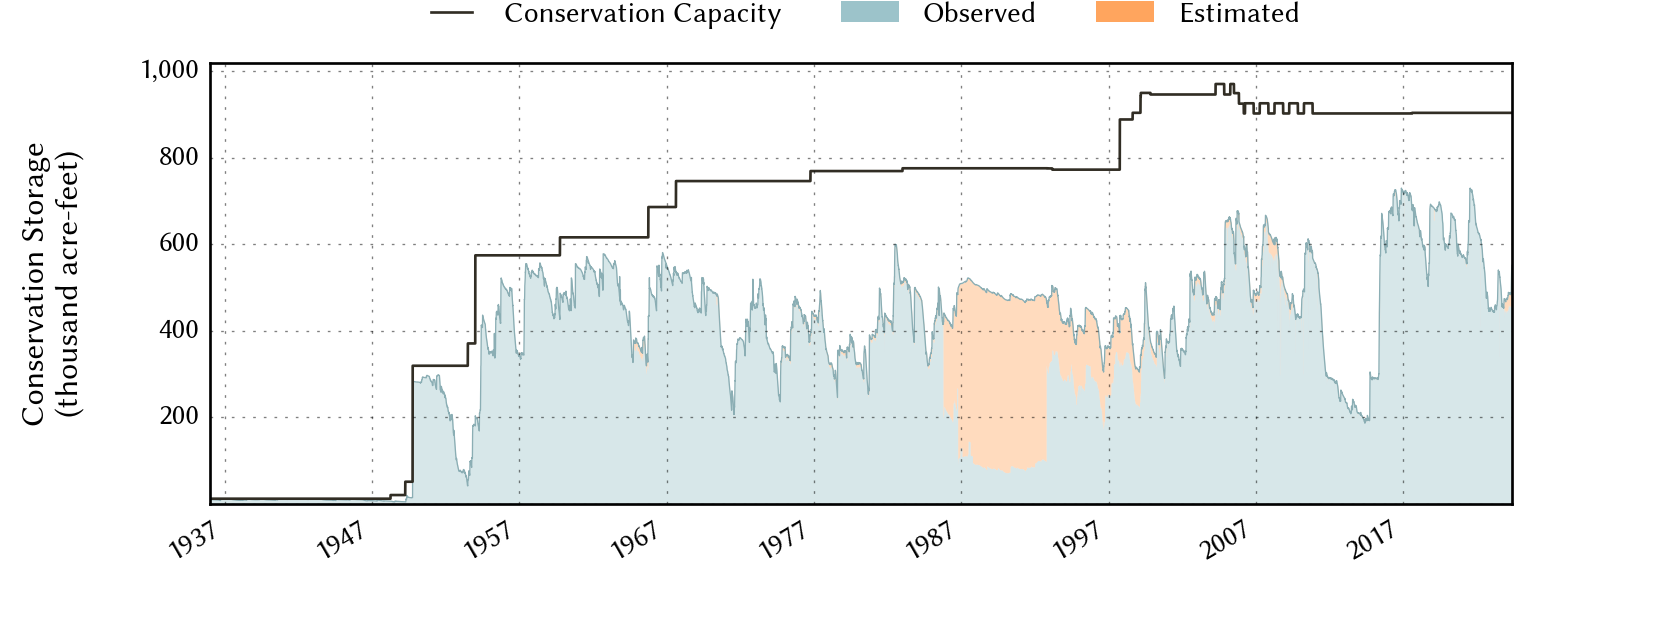
Historical Data
| Date | Percent Full |
Reservoir Storage (acre-ft) |
Conservation Storage (acre-ft) |
Conservation Capacity (acre-ft) |
|
|---|---|---|---|---|---|
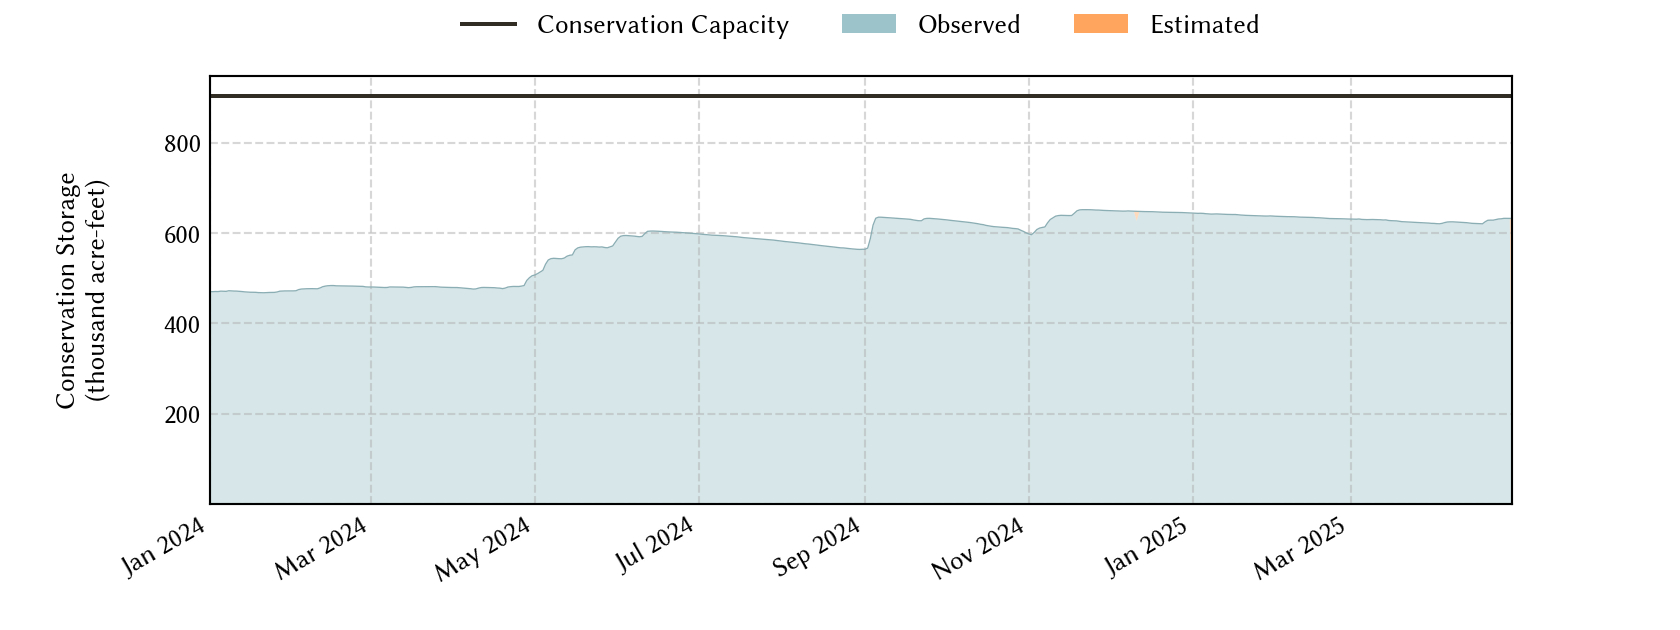
| Today | 2026-07-29 | 58.3 | 529,135 | 526,591 | 903,870 |
| Yesterday | 2026-07-28 | 58.4 | 529,965 | 527,421 | 903,870 |
| 2 days ago | 2026-07-27 | 58.5 | 530,994 | 528,450 | 903,870 |
| 1 week ago | 2026-07-22 | 59.0 | 535,863 | 533,319 | 903,870 |
| 1 month ago | 2026-06-29 | 61.6 | 559,488 | 556,944 | 903,870 |
| 3 months ago | 2026-04-29 | 62.5 | 567,382 | 564,838 | 903,870 |
| 6 months ago | 2026-01-29 | 64.5 | 585,639 | 583,095 | 903,870 |
| 1 year ago | 2025-07-29 | 72.1 | 692,329 | 651,426 | 903,870 |
*
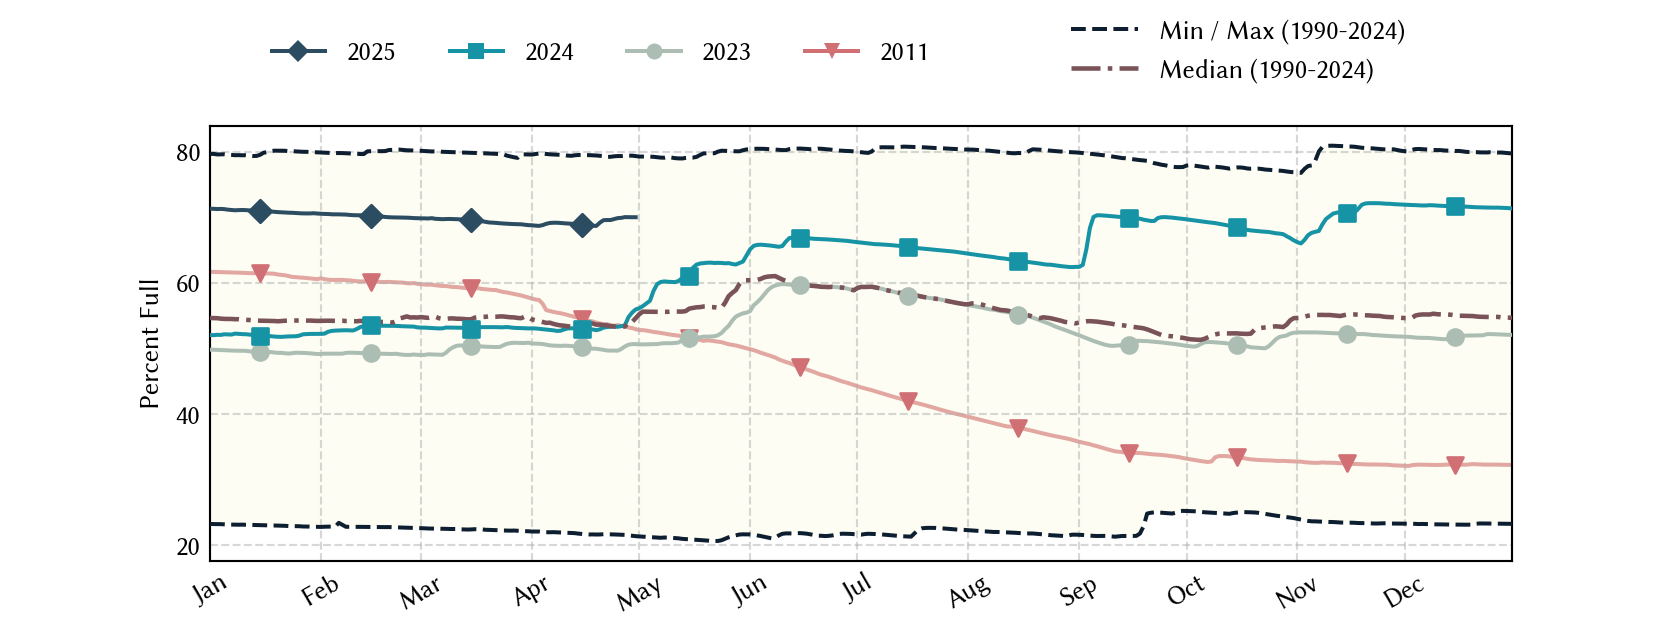
Percent Full is based on Conservation Storage and Conservation Capacity and doesn't account for storage in flood pool.
Area Map
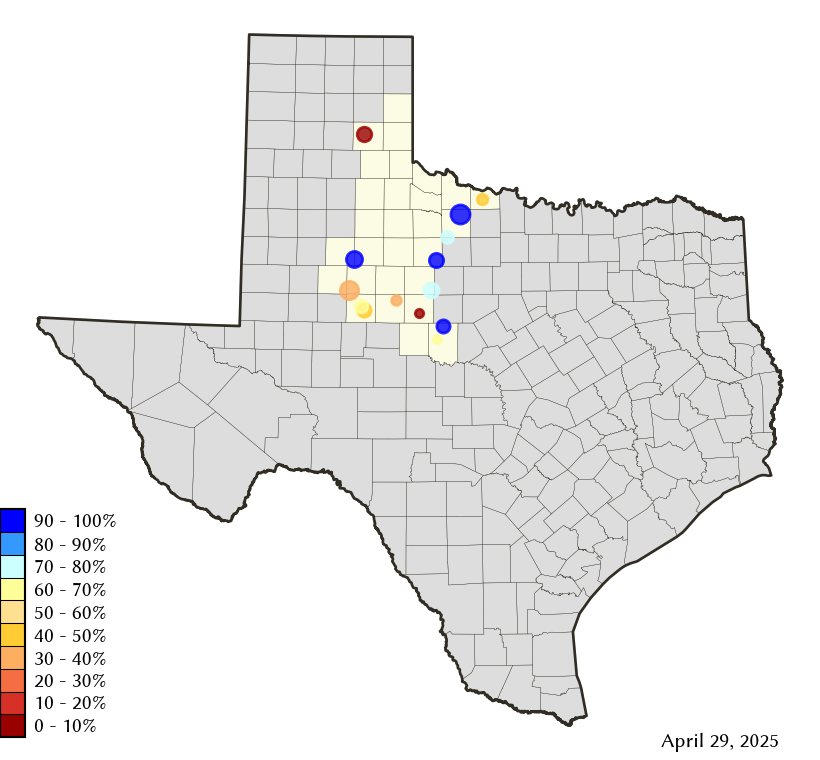
Reservoir Storage
| Reservoir | Type | Percent Full |
Water Level (ft) |
Height Above Conservation Pool (ft) |
Reservoir Storage (acre-ft) |
Conservation Storage (acre-ft) |
Conservation Capacity (acre-ft) |
Surface Area (acres) |
|---|---|---|---|---|---|---|---|---|
| Abilene |

|
13.0 | 1,994.29 | -18.01 | 1,028 | 1,028 | 7,900 | 176 |
| Alan Henry |
|
76.3 | 2,210.85 | -9.15 | 73,404 | 73,404 | 96,207 | 2,229 |
| Champion Creek |
|
45.1 | 2,063.76 | -19.24 | 18,745 | 18,745 | 41,580 | 890 |
| Coleman |
|
84.6 | 1,714.17 | -3.33 | 32,241 | 32,223 | 38,075 | 1,696 |
| Colorado City |
|
57.9 | 2,060.15 | -10.05 | 17,824 | 17,824 | 30,758 | - n.a. - |
| Fort Phantom Hill |
|
75.3 | 1,631.01 | -4.89 | 52,718 | 52,712 | 70,030 | 3,182 |
| Greenbelt |
|
5.7 | 2,609.17 | -54.83 | 3,849 | 3,417 | 59,968 | 308 |
| Hords Creek |

|
51.0 | 1,889.95 | -10.05 | 4,142 | 4,139 | 8,109 | 296 |
| J B Thomas |
|
23.9 | 2,228.50 | -29.50 | 48,471 | 47,798 | 199,931 | 3,325 |
| Kemp |
|
82.9 | 1,141.70 | -2.30 | 203,506 | 203,380 | 245,307 | 11,441 |
| Millers Creek |
|
66.5 | 1,329.23 | -4.77 | 19,085 | 17,802 | 26,768 | 1,534 |
| North Fork Buffalo Creek |
|
85.5 | 1,046.60 | -1.40 | 13,174 | 13,174 | 15,400 | 1,362 |
| Stamford |
|
74.7 | 1,414.22 | -2.58 | 38,549 | 38,546 | 51,570 | 4,138 |
| Sweetwater |
|
19.6 | 2,092.19 | -24.31 | 2,399 | 2,399 | 12,267 | 223 |