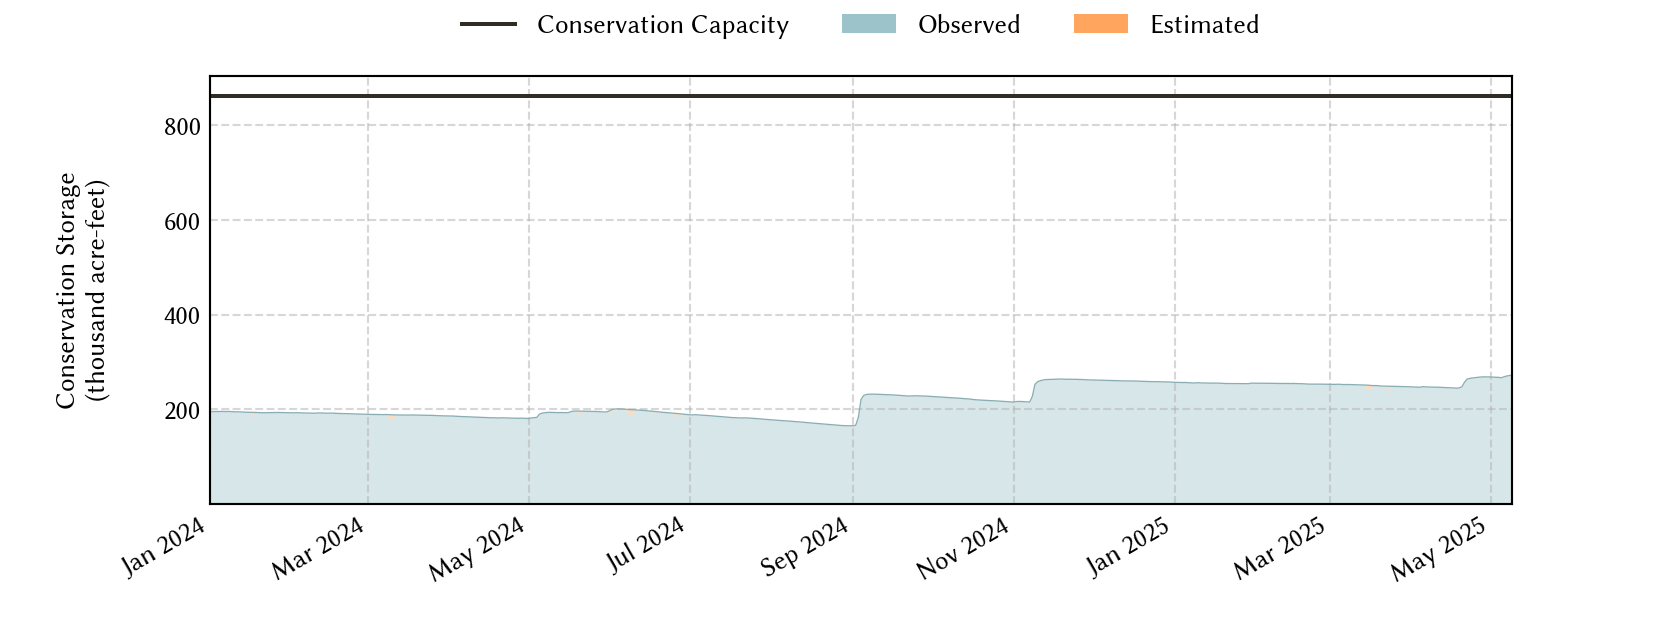
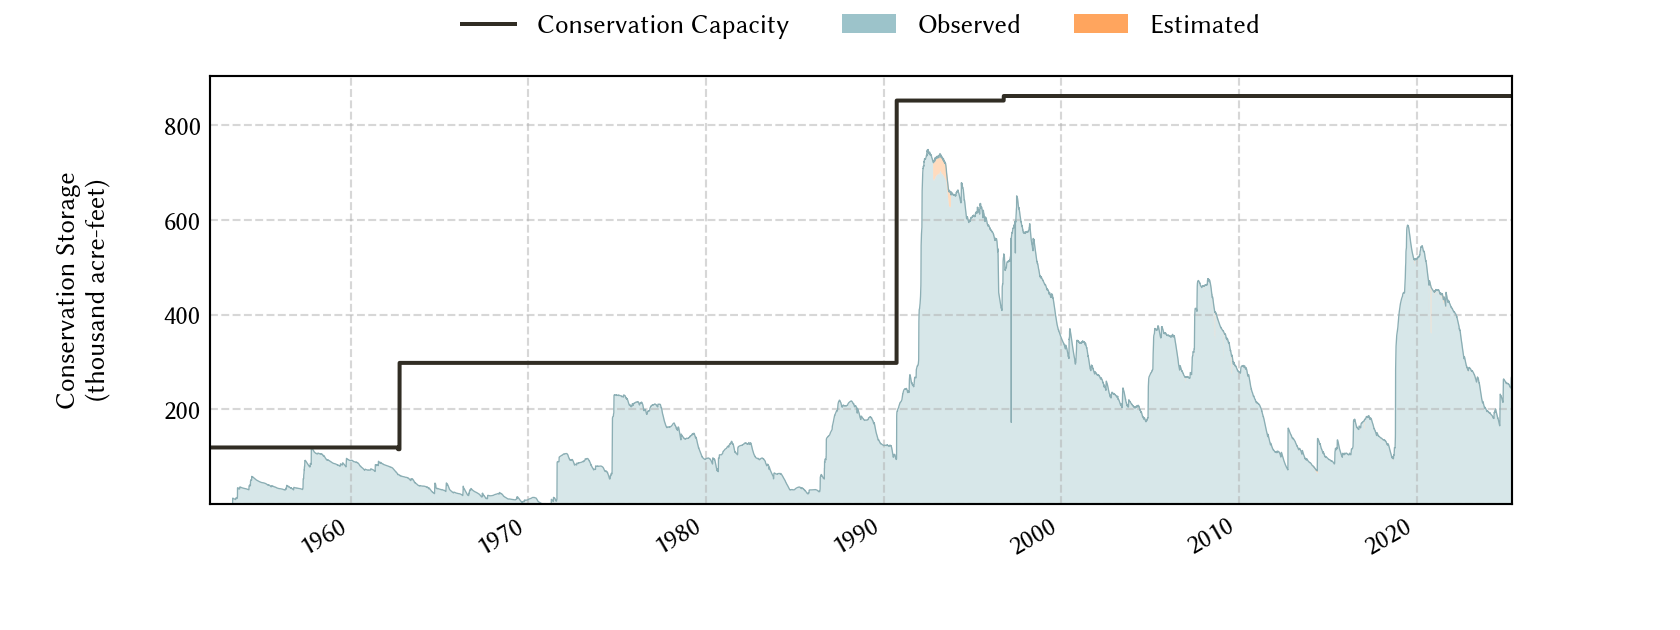
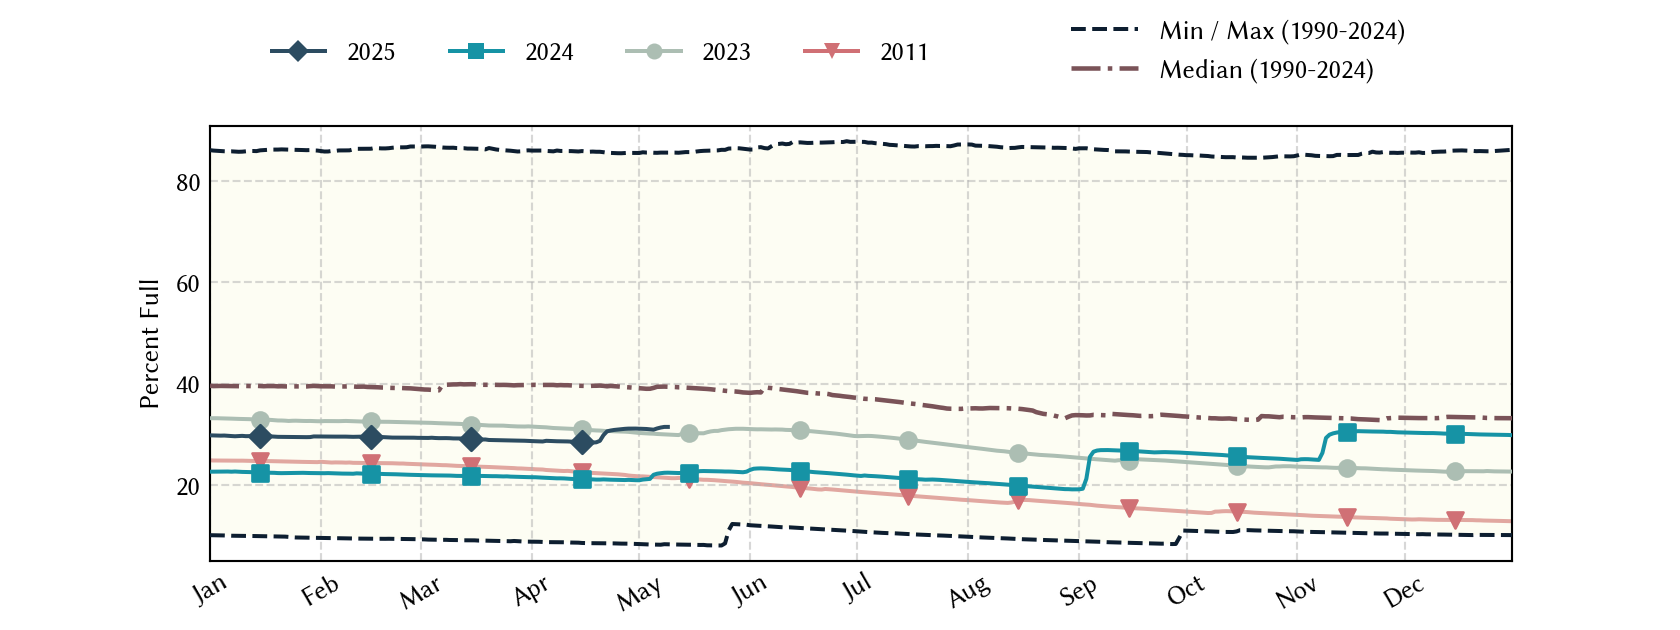
San Angelo Area Reservoirs: Monitored Water Supply Reservoirs are 35.0% full on 2026-05-15
Historical Data
| Date | Percent Full |
Reservoir Storage (acre-ft) |
Conservation Storage (acre-ft) |
Conservation Capacity (acre-ft) |
|
|---|---|---|---|---|---|
| Today | 2026-05-15 | 35.0 | 305,877 | 301,634 | 862,151 |
| Yesterday | 2026-05-14 | 35.0 | 306,205 | 301,962 | 862,151 |
| 2 days ago | 2026-05-13 | 35.1 | 306,496 | 302,253 | 862,151 |
| 1 week ago | 2026-05-08 | 35.1 | 306,446 | 302,203 | 862,151 |
| 1 month ago | 2026-04-15 | 35.2 | 307,985 | 303,742 | 862,151 |
| 3 months ago | 2026-02-15 | 35.1 | 306,605 | 302,362 | 862,151 |
| 6 months ago | 2025-11-15 | 35.9 | 313,959 | 309,716 | 862,151 |
| 1 year ago | 2025-05-15 | 31.4 | 275,032 | 270,789 | 862,151 |
*
Percent Full is based on Conservation Storage and Conservation Capacity and doesn't account for storage in flood pool.
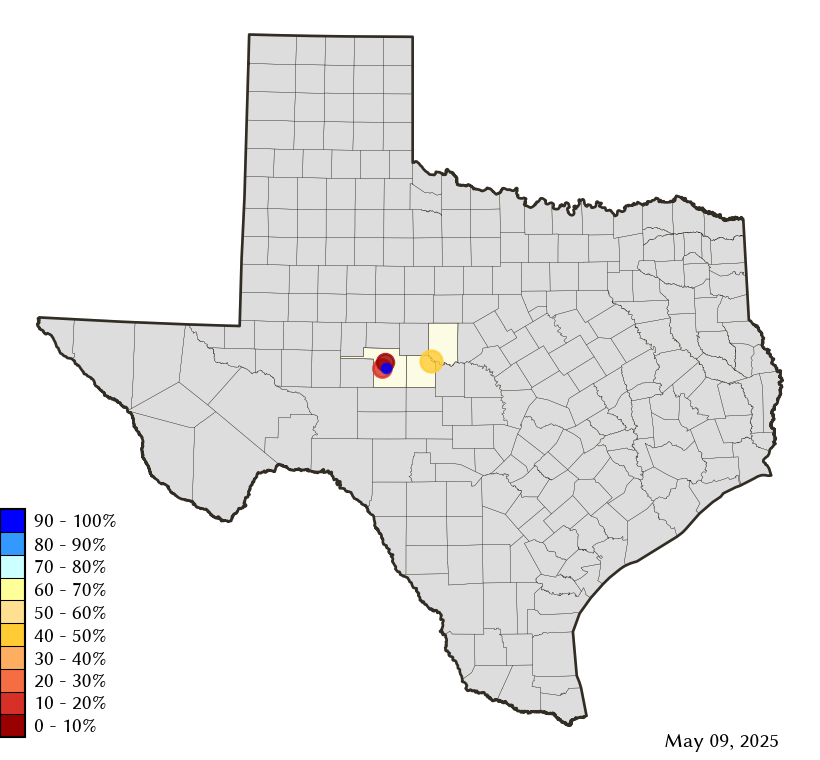
Area Map
Reservoir Storage
| Reservoir | Type | Percent Full |
Water Level (ft) |
Height Above Conservation Pool (ft) |
Reservoir Storage (acre-ft) |
Conservation Storage (acre-ft) |
Conservation Capacity (acre-ft) |
Surface Area (acres) |
|---|---|---|---|---|---|---|---|---|
| Nasworthy |

|
86.0 | 1,871.76 | -0.95 | 8,762 | 8,269 | 9,615 | 1,236 |
| O C Fisher |

|
14.1 | 1,875.33 | -32.67 | 16,264 | 16,263 | 115,742 | 1,323 |
| O H Ivie |
|
46.7 | 1,532.01 | -19.49 | 258,903 | 258,903 | 554,340 | - n.a. - |
| Twin Buttes |
|
10.0 | 1,902.51 | -37.69 | 21,948 | 18,199 | 182,454 | 1,536 |