Lower-Colorado Planning Region Reservoirs: Monitored Water Supply Reservoirs are 92.6% full on 2026-06-26
Historical Data
| Date | Percent Full |
Reservoir Storage (acre-ft) |
Conservation Storage (acre-ft) |
Conservation Capacity (acre-ft) |
|
|---|---|---|---|---|---|
| Today | 2026-06-26 | 92.6 | 2,017,012 | 1,966,586 | 2,122,814 |
| Yesterday | 2026-06-25 | 92.7 | 2,017,562 | 1,967,136 | 2,122,814 |
| 2 days ago | 2026-06-24 | 92.7 | 2,017,525 | 1,967,099 | 2,122,814 |
| 1 week ago | 2026-06-19 | 91.8 | 1,998,331 | 1,947,905 | 2,122,814 |
| 1 month ago | 2026-05-26 | 88.0 | 1,918,984 | 1,868,558 | 2,122,814 |
| 3 months ago | 2026-03-26 | 84.4 | 1,842,395 | 1,791,969 | 2,122,814 |
| 6 months ago | 2025-12-26 | 87.6 | 1,910,545 | 1,860,119 | 2,122,814 |
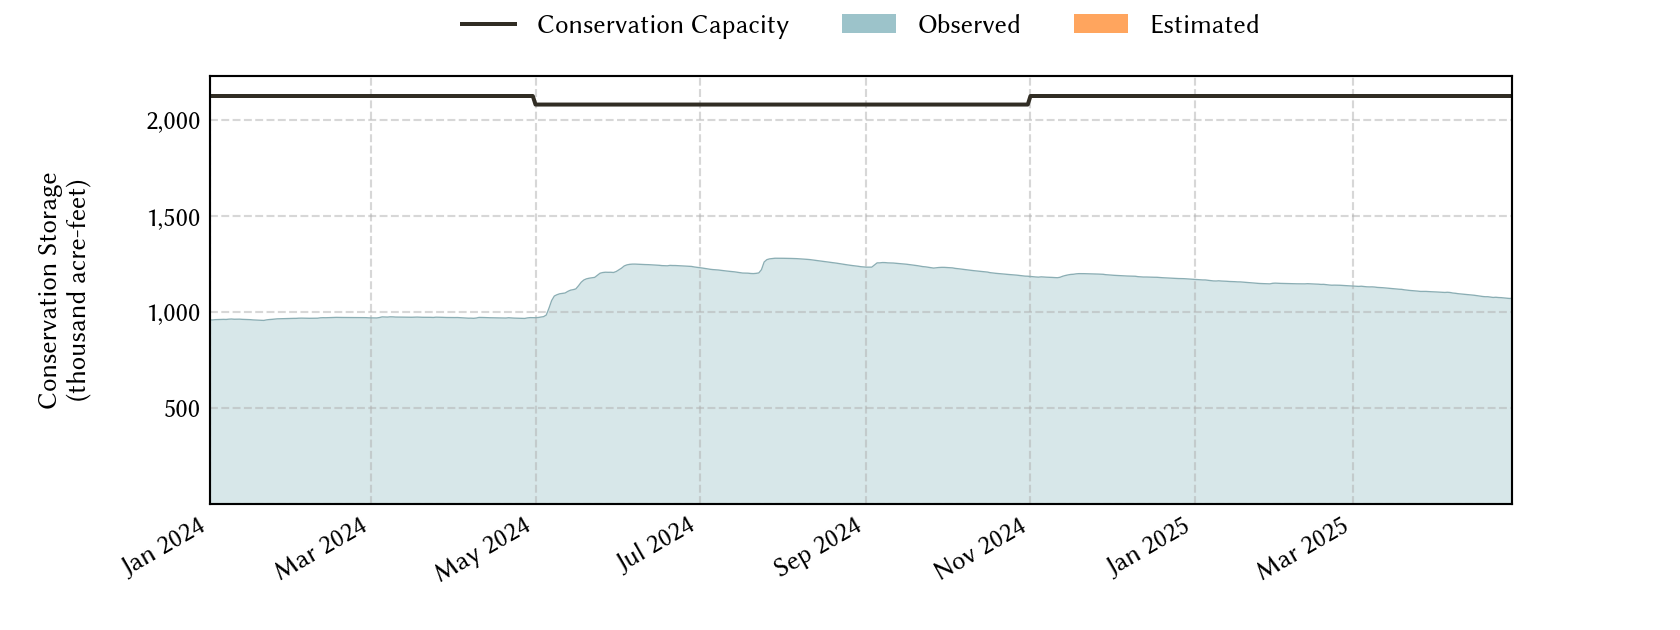
| 1 year ago | 2025-06-26 | 54.6 | 1,209,458 | 1,159,032 | 2,122,814 |
*
Percent Full is based on Conservation Storage and Conservation Capacity and doesn't account for storage in flood pool.
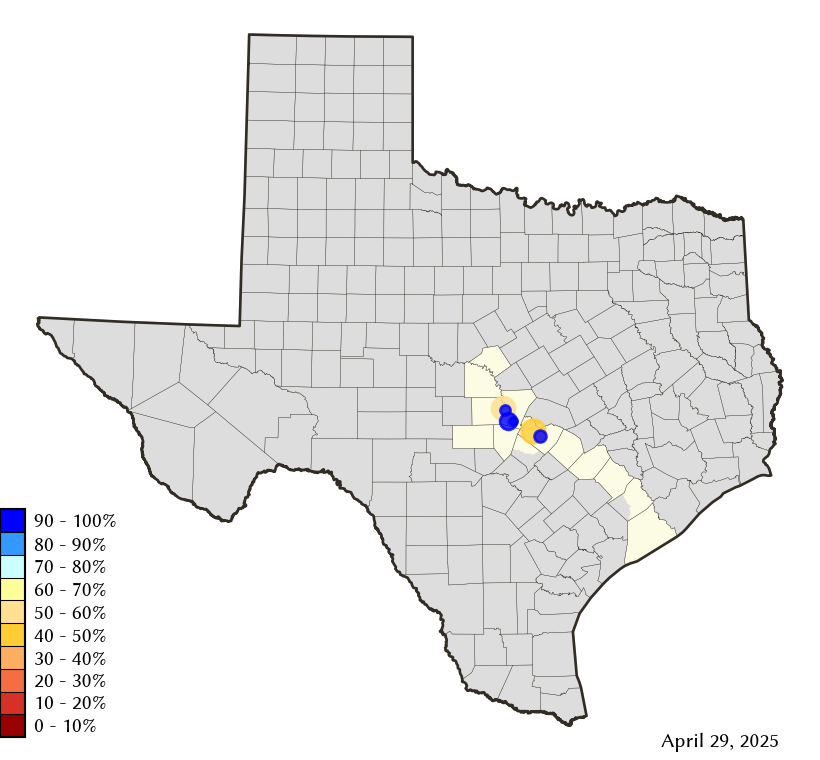
Area Map
Reservoir Storage
| Reservoir | Type | Percent Full |
Water Level (ft) |
Height Above Conservation Pool (ft) |
Reservoir Storage (acre-ft) |
Conservation Storage (acre-ft) |
Conservation Capacity (acre-ft) |
Surface Area (acres) |
|---|---|---|---|---|---|---|---|---|
| Austin |

|
97.4 | 492.41 | -0.39 | 23,969 | 23,360 | 23,972 | 1,557 |
| Buchanan |
|
99.8 | 1,019.93 | -0.07 | 878,785 | 865,123 | 866,694 | 22,435 |
| Inks |
|
95.3 | 887.19 | -0.81 | 13,367 | 13,084 | 13,729 | 790 |
| Lyndon B Johnson |
|
98.3 | 824.71 | -0.29 | 129,757 | 110,917 | 112,778 | 6,405 |
| Marble Falls |
|
93.9 | 736.24 | -0.76 | 7,137 | 7,137 | 7,597 | 598 |
| Travis |

|
86.2 | 672.64 | -8.36 | 963,997 | 946,965 | 1,098,044 | 17,056 |