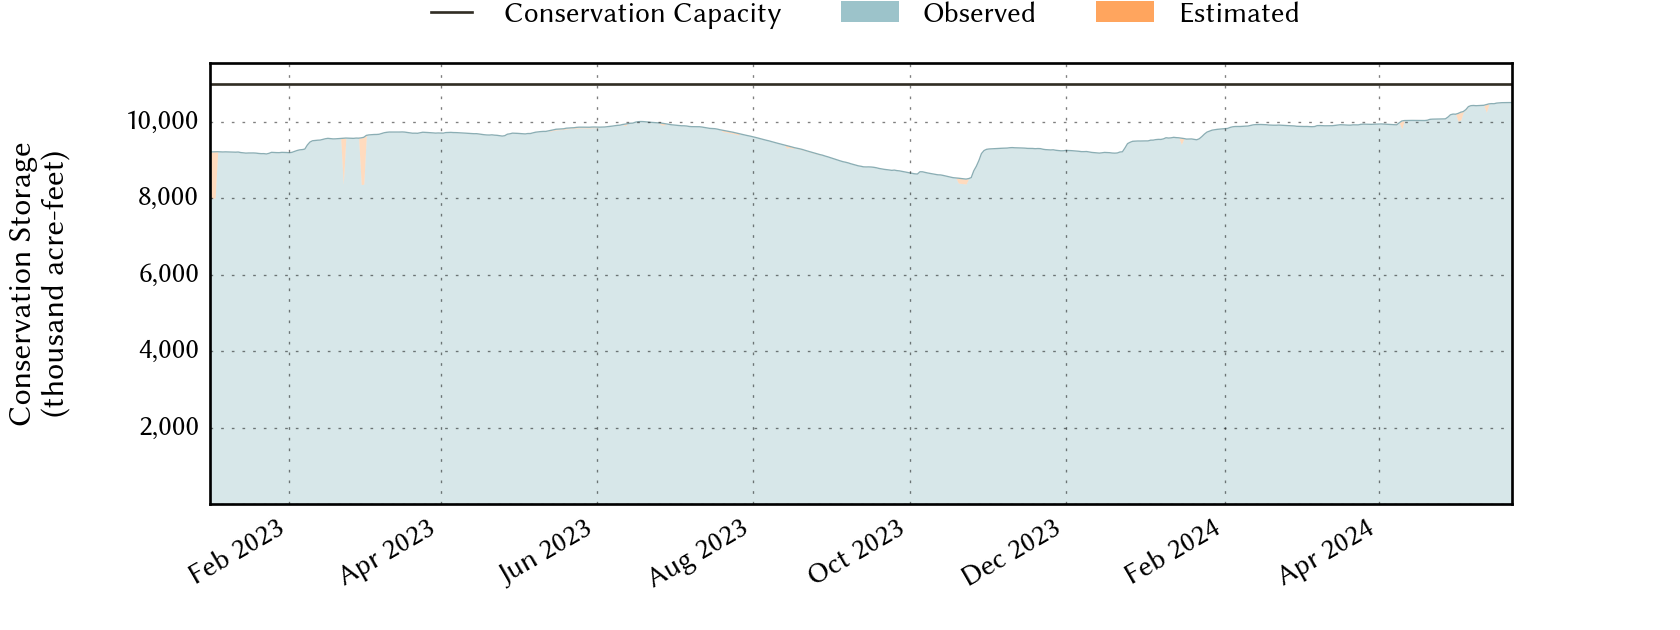
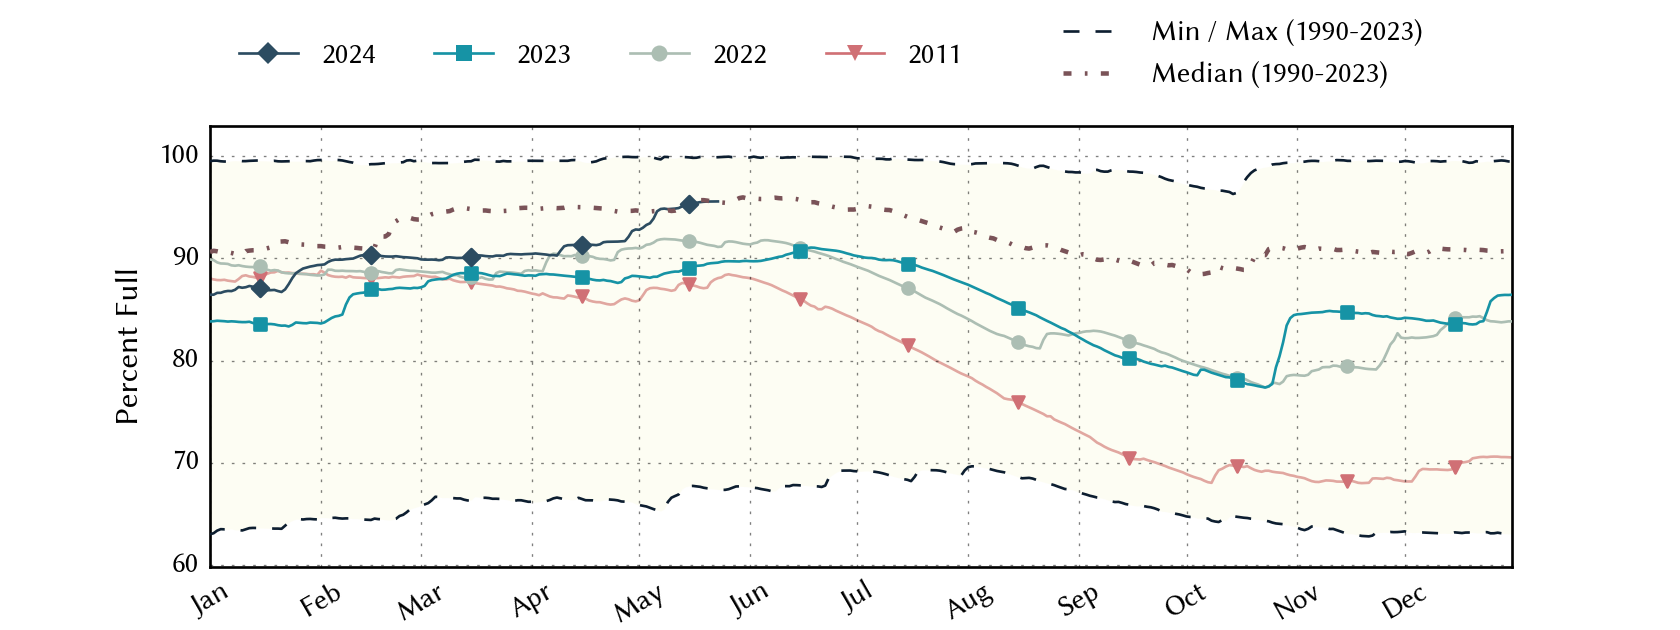
North-Central Climate Division Reservoirs: Monitored Water Supply Reservoirs are 95.1% full on 2026-07-21
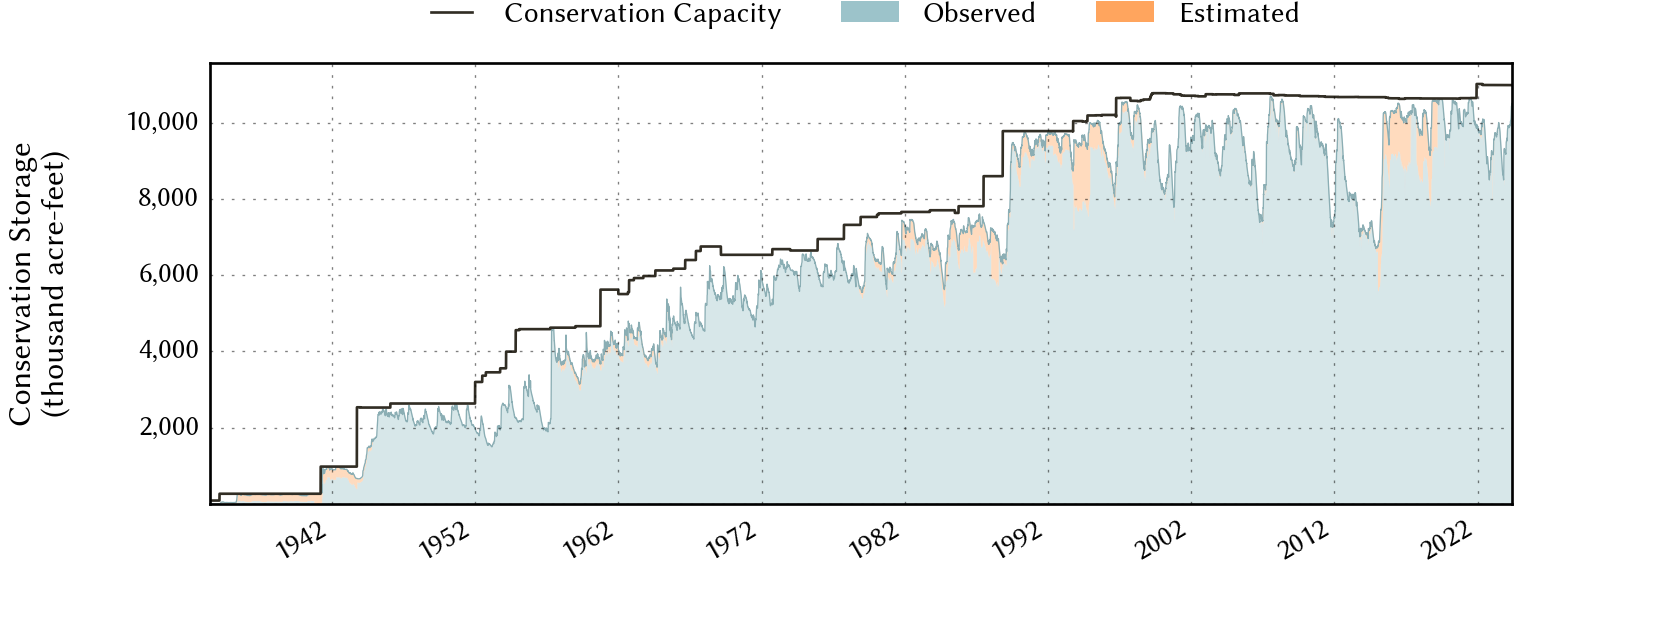
Historical Data
| Date | Percent Full |
Reservoir Storage (acre-ft) |
Conservation Storage (acre-ft) |
Conservation Capacity (acre-ft) |
|
|---|---|---|---|---|---|
| Most recent | 2026-07-21 | 95.1 | 11,984,834 | 10,441,962 | 10,983,823 |
| 1 day prior | 2026-07-20 | 95.1 | 11,996,453 | 10,448,975 | 10,983,823 |
| 2 days prior | 2026-07-19 | 95.2 | 12,006,423 | 10,454,933 | 10,983,823 |
| 1 week prior | 2026-07-14 | 95.0 | 12,000,614 | 10,437,825 | 10,983,823 |
| 1 month prior | 2026-06-21 | 95.8 | 12,321,142 | 10,523,140 | 10,983,823 |
| 3 months prior | 2026-04-21 | 93.5 | 11,699,419 | 10,271,837 | 10,983,823 |
| 6 months prior | 2026-01-21 | 90.5 | 11,311,016 | 9,943,042 | 10,983,823 |
| 1 year prior | 2025-07-21 | 98.1 | 12,515,607 | 10,772,566 | 10,983,823 |
*
Percent Full is based on Conservation Storage and Conservation Capacity and doesn't account for storage in flood pool.
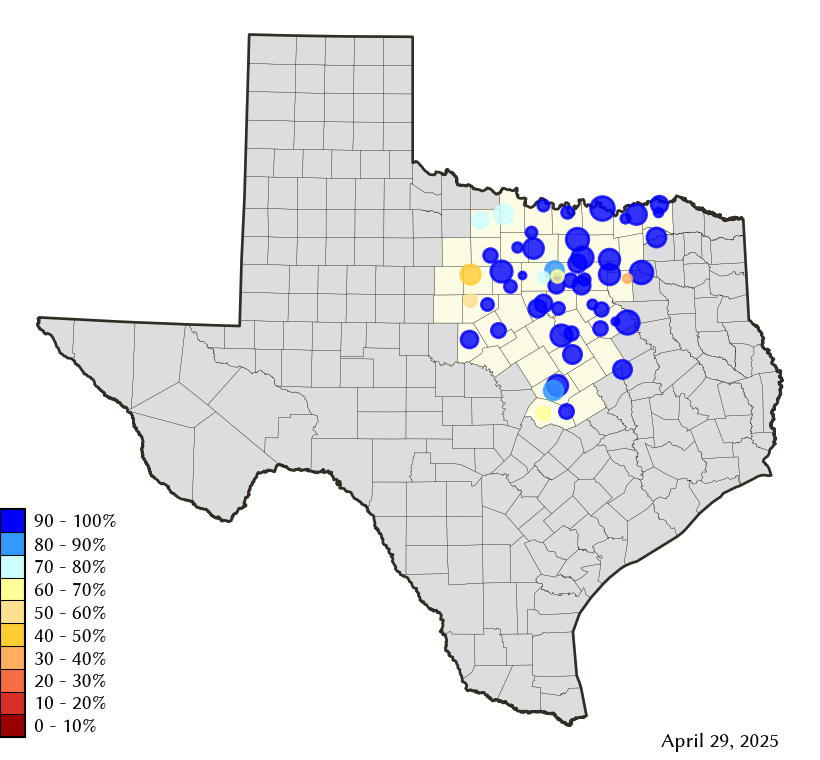
Area Map
Reservoir Storage
| Reservoir | Type | Percent Full |
Water Level (ft) |
Height Above Conservation Pool (ft) |
Reservoir Storage (acre-ft) |
Conservation Storage (acre-ft) |
Conservation Capacity (acre-ft) |
Surface Area (acres) |
|---|---|---|---|---|---|---|---|---|
| Amon G Carter |

|
86.0 | 918.08 | -1.92 | 17,352 | 16,568 | 19,266 | 1,345 |
| Aquilla |

|
100.0 | 538.34 | 0.84 | 45,911 | 43,243 | 43,243 | - n.a. - |
| Arlington |
|
90.8 | 548.05 | -1.95 | 36,486 | 36,454 | 40,157 | 1,877 |
| Arrowhead |
|
79.9 | 922.61 | -3.39 | 184,148 | 184,148 | 230,359 | 12,757 |
| Bardwell |
|
100.0 | 421.01 | 0.01 | 43,951 | 43,856 | 43,856 | 3,307 |
| Belton |
|
100.0 | 595.11 | 1.11 | 446,606 | 432,631 | 432,631 | - n.a. - |
| Benbrook |
|
94.0 | 692.58 | -1.42 | 80,550 | 80,550 | 85,648 | 3,511 |
| Bois d'Arc |
|
99.5 | 533.89 | -0.11 | 365,841 | 365,841 | 367,609 | 16,478 |
| Bonham |
|
95.7 | 564.54 | -0.46 | 10,560 | 10,548 | 11,027 | 1,030 |
| Bridgeport |
|
85.4 | 831.38 | -4.62 | 317,908 | 317,908 | 372,183 | 11,248 |
| Brownwood |
|
93.0 | 1,423.52 | -1.08 | 121,670 | 121,670 | 130,868 | 6,510 |
| Cisco |
|
45.8 | 1,504.64 | -17.82 | 13,275 | 13,275 | 29,003 | 616 |
| Comanche Creek |
|
100.0 | 775.46 | 0.46 | 152,734 | 151,250 | 151,250 | - n.a. - |
| Crook |
|
99.1 | 475.92 | -0.08 | 9,127 | 9,112 | 9,195 | 1,049 |
| Eagle Mountain |
|
85.7 | 646.08 | -3.02 | 158,619 | 158,619 | 185,087 | 8,337 |
| Georgetown |
|
100.0 | 792.47 | 1.47 | 40,022 | 38,005 | 38,005 | - n.a. - |
| Graham |
|
75.4 | 1,070.16 | -4.84 | 34,151 | 34,137 | 45,288 | 2,108 |
| Granbury |
|
95.5 | 691.96 | -0.74 | 127,911 | 127,002 | 132,949 | 7,902 |
| Granger |
|
100.0 | 506.43 | 2.43 | 62,446 | 51,822 | 51,822 | - n.a. - |
| Grapevine |
|
100.0 | 535.28 | 0.28 | 164,920 | 163,064 | 163,064 | - n.a. - |
| Halbert |
|
83.3 | 366.19 | -1.81 | 5,025 | 5,025 | 6,033 | 536 |
| Hubbard Creek |
|
41.4 | 1,168.13 | -15.18 | 134,719 | 129,843 | 313,298 | 8,746 |
| Hubert H Moss |
|
97.3 | 714.39 | -0.61 | 23,500 | 23,403 | 24,058 | 1,065 |
| Jim Chapman |
|
86.9 | 438.05 | -1.95 | 260,495 | 224,720 | 258,723 | 16,876 |
| Joe Pool |
|
99.5 | 521.89 | -0.11 | 150,265 | 148,895 | 149,629 | 6,657 |
| Kickapoo |
|
87.8 | 1,043.13 | -1.87 | 75,777 | 75,777 | 86,345 | 5,439 |
| Lavon |
|
99.3 | 491.86 | -0.14 | 409,715 | 406,874 | 409,757 | 20,555 |
| Leon |
|
85.6 | 1,372.60 | -2.40 | 24,054 | 23,774 | 27,762 | 1,567 |
| Lewisville |
|
99.7 | 521.94 | -0.06 | 597,282 | 561,608 | 563,228 | 27,042 |
| Limestone |
|
97.5 | 362.59 | -0.41 | 198,722 | 198,722 | 203,780 | 12,262 |
| Lost Creek |
|
93.4 | 1,007.52 | -1.98 | 11,160 | 11,160 | 11,950 | - n.a. - |
| Mineral Wells |
|
98.4 | 862.82 | -0.18 | 5,189 | 5,189 | 5,273 | 462 |
| Mountain Creek |
|
100.0 | 457.59 | 0.59 | 24,381 | 22,850 | 22,850 | 2,852 |
| Navarro Mills |
|
95.4 | 424.01 | -0.49 | 47,546 | 47,545 | 49,827 | 4,606 |
| New Terrell City |
|
30.8 | 494.89 | -9.11 | 2,658 | 2,647 | 8,583 | 412 |
| Nocona |
|
81.3 | 824.38 | -3.12 | 17,742 | 17,438 | 21,444 | 1,226 |
| Palo Pinto |
|
93.6 | 866.21 | -0.79 | 25,447 | 25,061 | 26,766 | 2,143 |
| Pat Cleburne |
|
96.4 | 732.90 | -0.60 | 25,075 | 25,075 | 26,008 | 1,547 |
| Pat Mayse |
|
100.0 | 451.70 | 0.70 | 121,817 | 113,683 | 113,683 | - n.a. - |
| Possum Kingdom |
|
94.2 | 997.21 | -1.79 | 506,806 | 506,806 | 538,139 | 17,091 |
| Proctor |
|
82.0 | 1,159.78 | -2.22 | 44,913 | 44,913 | 54,762 | 4,239 |
| Ray Hubbard |
|
98.2 | 435.11 | -0.39 | 431,480 | 431,480 | 439,559 | 20,519 |
| Ray Roberts |
|
100.0 | 632.59 | 0.09 | 791,045 | 788,167 | 788,167 | - n.a. - |
| Richland-Chambers |
|
96.8 | 314.18 | -0.82 | 1,089,492 | 1,063,709 | 1,099,417 | 43,219 |
| Stillhouse Hollow |
|
100.0 | 623.23 | 1.23 | 237,899 | 229,796 | 229,796 | - n.a. - |
| Tawakoni |
|
99.4 | 437.37 | -0.13 | 866,891 | 866,883 | 871,685 | 36,851 |
| Texoma 1 |
|
100.0 | 618.57 | 1.57 | 2,609,886 | 1,243,801 | 1,243,801 | 82,267 |
| Waco |
|
99.2 | 462.04 | -0.18 | 187,600 | 187,374 | 188,891 | 8,407 |
| Waxahachie |
|
96.9 | 530.98 | -0.52 | 11,303 | 10,721 | 11,060 | 648 |
| Weatherford |
|
64.5 | 889.59 | -6.41 | 11,492 | 11,492 | 17,812 | 902 |
| Whitney |
|
100.0 | 533.11 | 0.11 | 568,722 | 564,808 | 564,808 | - n.a. - |
| Worth |
|
80.0 | 592.54 | -1.46 | 28,618 | 19,542 | 24,419 | 3,254 |
footnotes
1
Lake Texoma straddles the border of Texas and Oklahoma, Texas has rights to 50% of Lake Texoma's total conservation capacity. Percent full, conservation storage and conservation capacity are based on the Texas share.