Tyler Area Reservoirs: Monitored Water Supply Reservoirs are 97.0% full on 2026-06-24
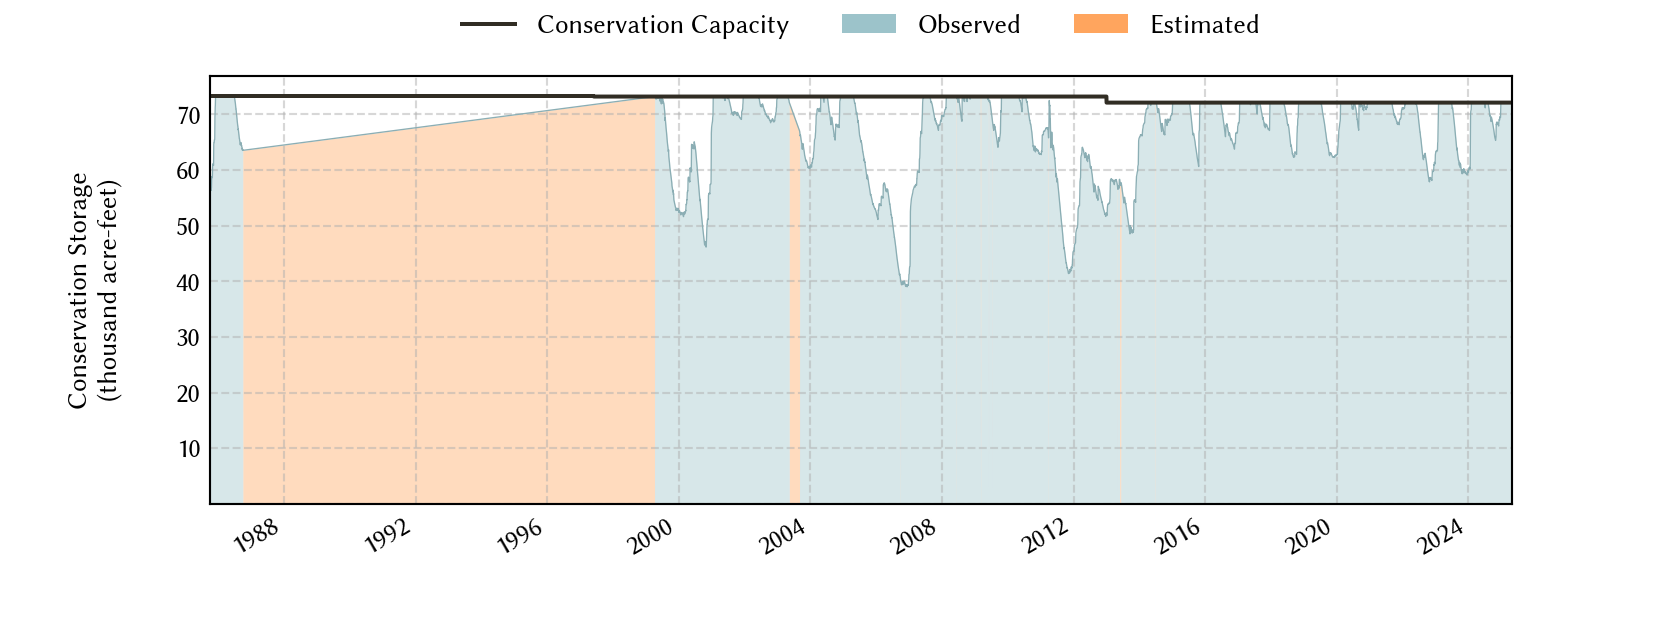
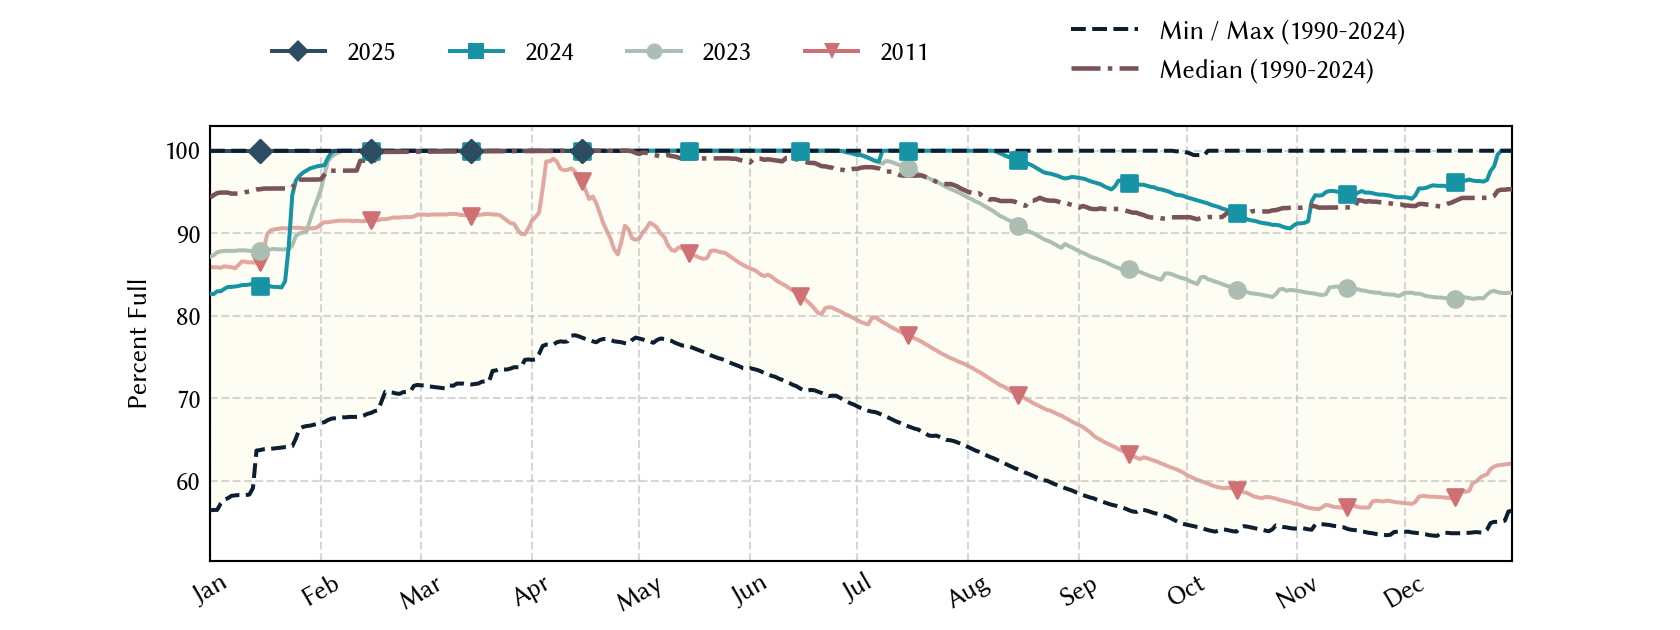
Historical Data
| Date | Percent Full |
Reservoir Storage (acre-ft) |
Conservation Storage (acre-ft) |
Conservation Capacity (acre-ft) |
|
|---|---|---|---|---|---|
| Today | 2026-06-24 | 97.0 | 75,093 | 69,882 | 72,073 |
| Yesterday | 2026-06-23 | 97.0 | 75,140 | 69,929 | 72,073 |
| 2 days ago | 2026-06-22 | 97.2 | 75,232 | 70,021 | 72,073 |
| 1 week ago | 2026-06-17 | 97.6 | 75,555 | 70,344 | 72,073 |
| 1 month ago | 2026-05-24 | 97.4 | 75,417 | 70,206 | 72,073 |
| 3 months ago | 2026-03-24 | 97.1 | 75,186 | 69,975 | 72,073 |
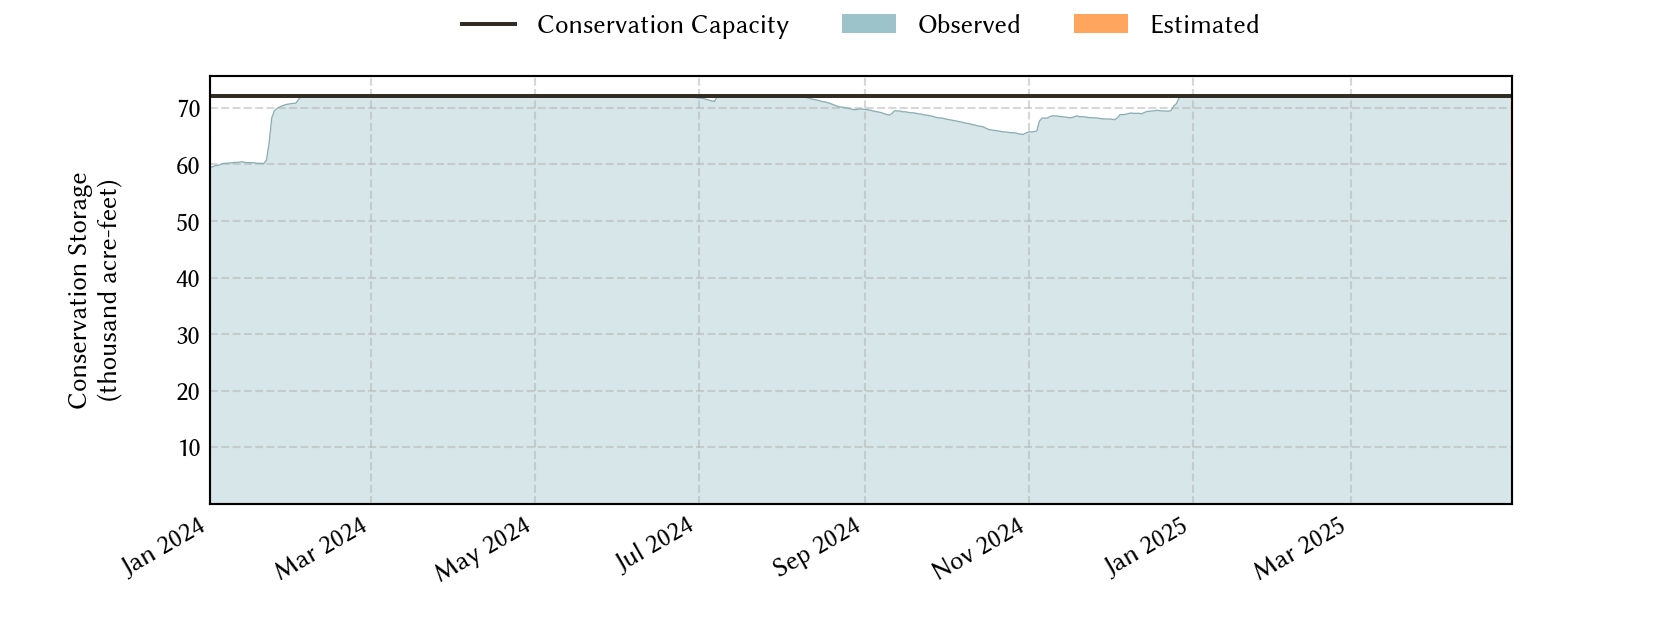
| 6 months ago | 2025-12-24 | 91.8 | 71,384 | 66,173 | 72,073 |
| 1 year ago | 2025-06-24 | 100.0 | 78,279 | 72,073 | 72,073 |
*
Percent Full is based on Conservation Storage and Conservation Capacity and doesn't account for storage in flood pool.
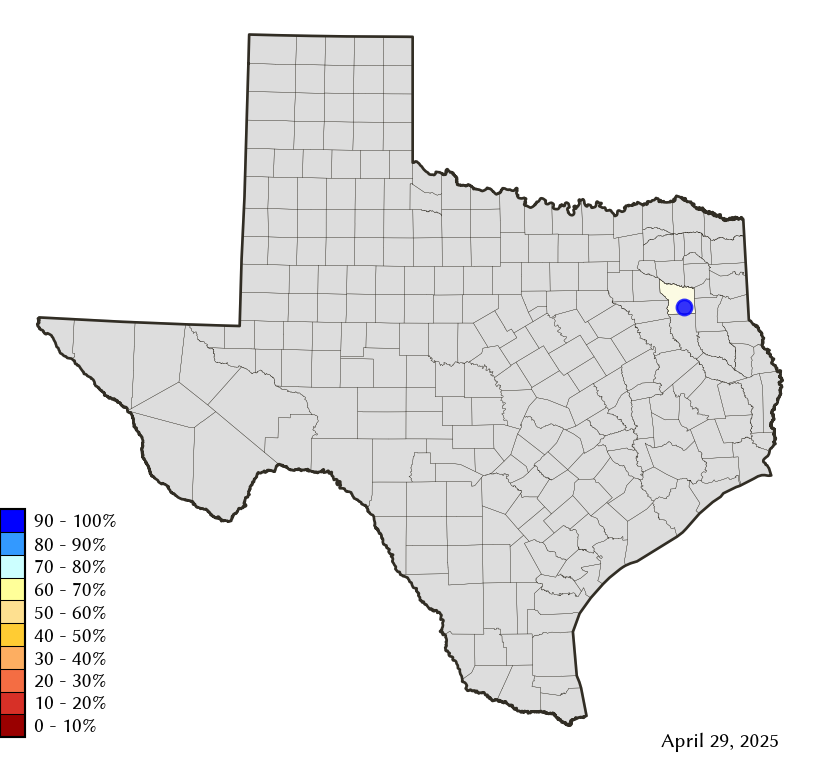
Area Map
Reservoir Storage
| Reservoir | Type | Percent Full |
Water Level (ft) |
Height Above Conservation Pool (ft) |
Reservoir Storage (acre-ft) |
Conservation Storage (acre-ft) |
Conservation Capacity (acre-ft) |
Surface Area (acres) |
|---|---|---|---|---|---|---|---|---|
| Tyler |

|
97.0 | 374.91 | -0.47 | 75,093 | 69,882 | 72,073 | 4,608 |