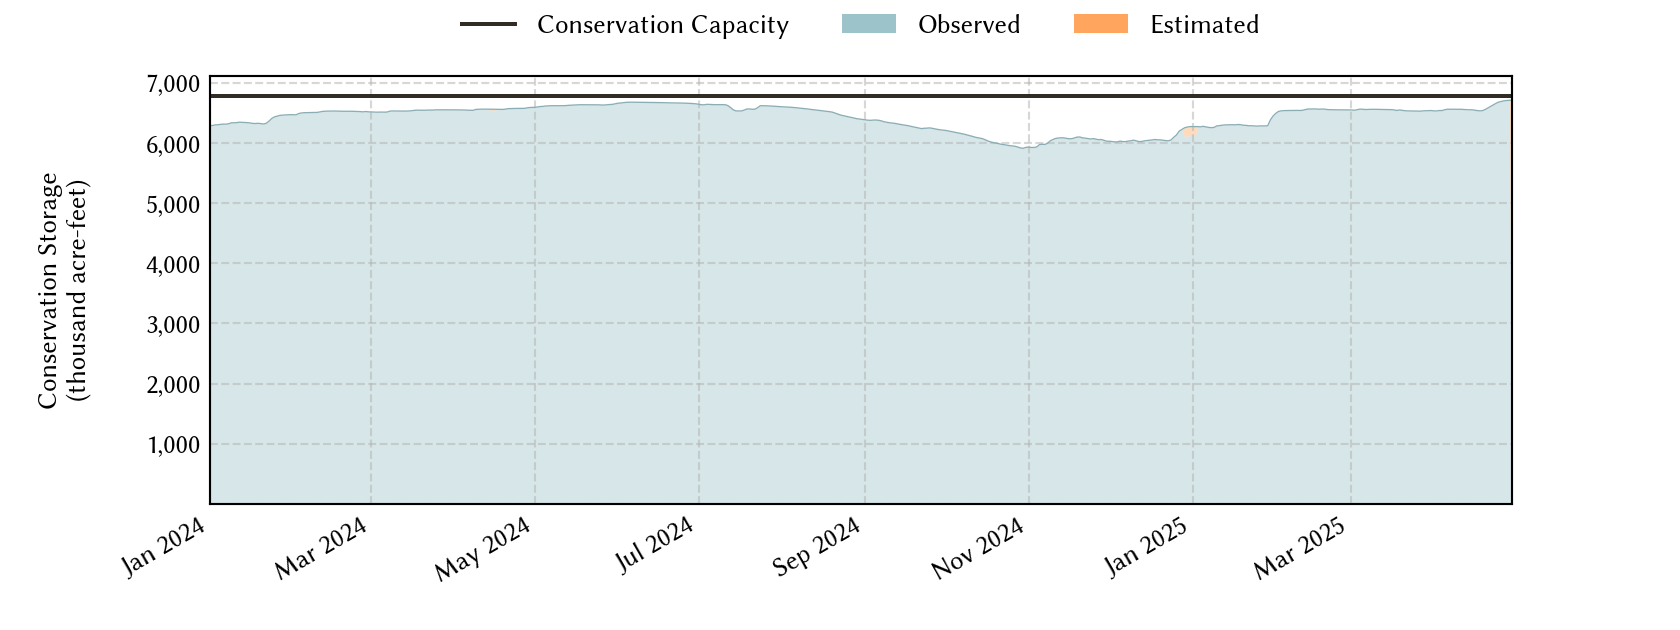
Trinity River Basin Reservoirs: Monitored Water Supply Reservoirs are 97.0% full on 2026-06-23
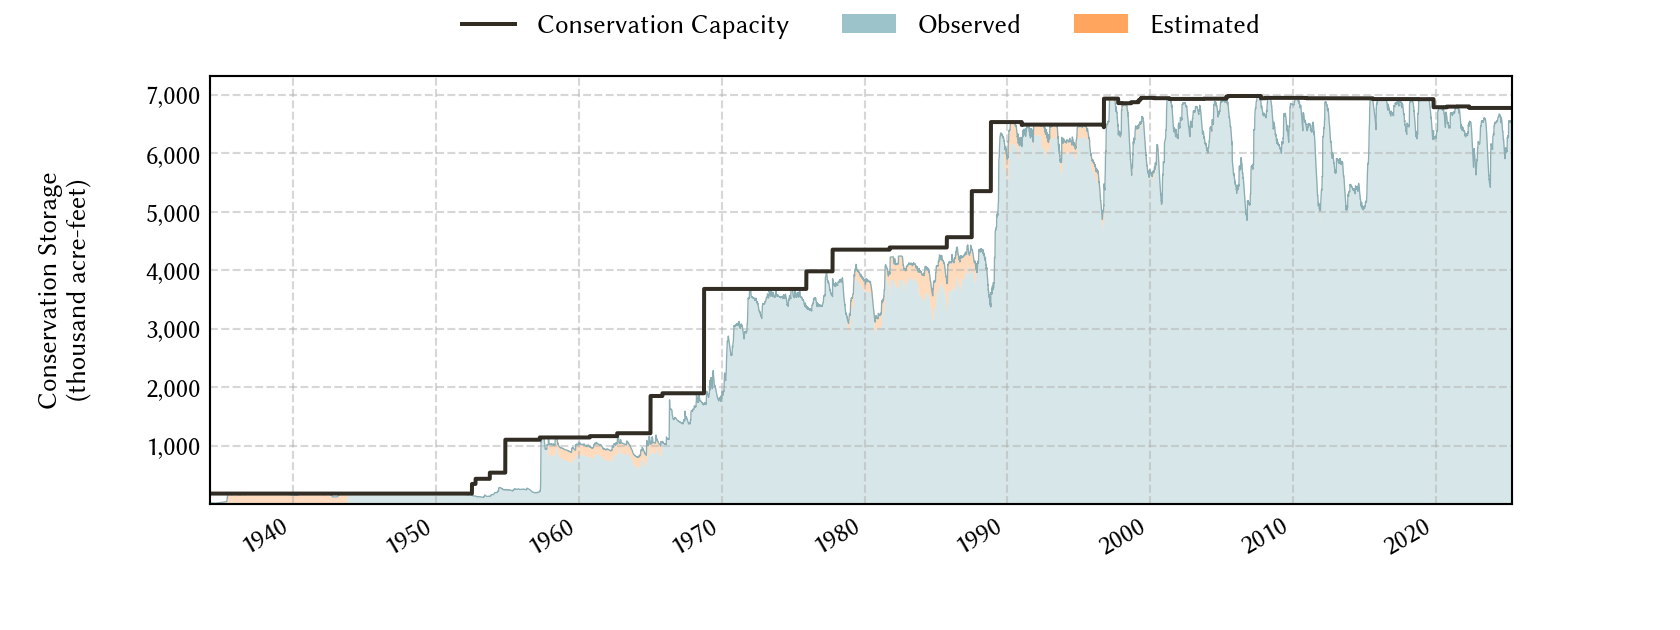
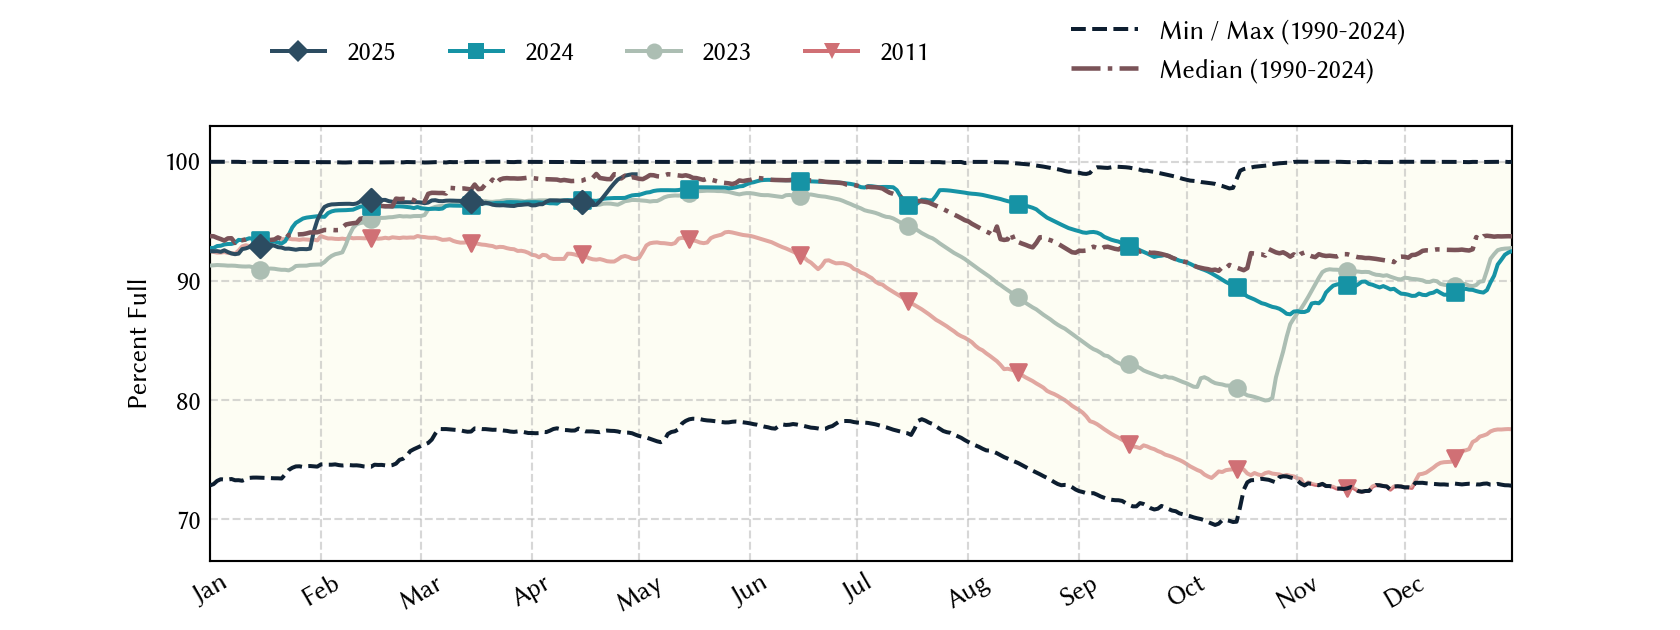
Historical Data
| Date | Percent Full |
Reservoir Storage (acre-ft) |
Conservation Storage (acre-ft) |
Conservation Capacity (acre-ft) |
|
|---|---|---|---|---|---|
| Today | 2026-06-23 | 97.0 | 6,891,146 | 6,571,222 | 6,776,855 |
| Yesterday | 2026-06-22 | 97.0 | 6,877,214 | 6,572,465 | 6,776,855 |
| 2 days ago | 2026-06-21 | 97.0 | 6,854,097 | 6,572,728 | 6,776,855 |
| 1 week ago | 2026-06-16 | 96.9 | 6,862,994 | 6,565,563 | 6,776,855 |
| 1 month ago | 2026-05-23 | 95.8 | 6,614,759 | 6,489,091 | 6,776,855 |
| 3 months ago | 2026-03-23 | 95.4 | 6,562,099 | 6,467,448 | 6,776,855 |
| 6 months ago | 2025-12-23 | 94.0 | 6,451,927 | 6,372,374 | 6,776,855 |
| 1 year ago | 2025-06-23 | 99.8 | 7,249,401 | 6,765,388 | 6,776,855 |
*
Percent Full is based on Conservation Storage and Conservation Capacity and doesn't account for storage in flood pool.
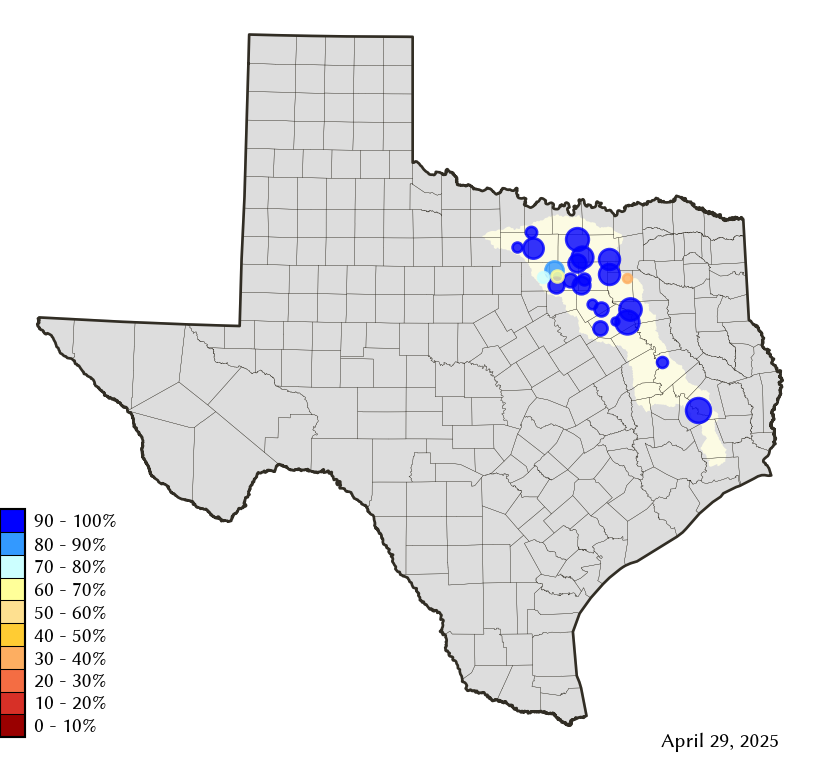
Area Map
Reservoir Storage
| Reservoir | Type | Percent Full |
Water Level (ft) |
Height Above Conservation Pool (ft) |
Reservoir Storage (acre-ft) |
Conservation Storage (acre-ft) |
Conservation Capacity (acre-ft) |
Surface Area (acres) |
|---|---|---|---|---|---|---|---|---|
| Amon G Carter |

|
90.3 | 918.69 | -1.31 | 18,180 | 17,396 | 19,266 | 1,391 |
| Arlington |
|
96.2 | 549.21 | -0.79 | 38,677 | 38,645 | 40,157 | 1,902 |
| Bardwell |

|
100.0 | 421.94 | 0.94 | 47,070 | 43,856 | 43,856 | 3,411 |
| Benbrook |
|
100.0 | 694.21 | 0.21 | 86,428 | 85,648 | 85,648 | - n.a. - |
| Bridgeport |
|
87.9 | 832.18 | -3.82 | 326,970 | 326,970 | 372,183 | 11,407 |
| Cedar Creek |
|
85.8 | 319.07 | -2.93 | 553,315 | 553,216 | 644,686 | 29,918 |
| Eagle Mountain |
|
95.0 | 648.09 | -1.01 | 175,917 | 175,917 | 185,087 | 8,910 |
| Grapevine |
|
100.0 | 536.14 | 1.14 | 170,743 | 163,064 | 163,064 | - n.a. - |
| Halbert |
|
82.9 | 366.15 | -1.85 | 5,004 | 5,004 | 6,033 | 535 |
| Houston County |
|
100.0 | 260.66 | 0.66 | 18,528 | 17,113 | 17,113 | - n.a. - |
| Joe Pool |
|
100.0 | 522.51 | 0.51 | 154,442 | 149,629 | 149,629 | 6,802 |
| Lavon |
|
100.0 | 493.99 | 1.99 | 454,719 | 409,757 | 409,757 | 21,696 |
| Lewisville |
|
100.0 | 524.50 | 2.50 | 668,603 | 563,228 | 563,228 | - n.a. - |
| Livingston |
|
100.0 | 131.73 | 0.73 | 1,661,600 | 1,603,504 | 1,603,504 | - n.a. - |
| Lost Creek |
|
95.4 | 1,008.18 | -1.32 | 11,396 | 11,396 | 11,950 | - n.a. - |
| Mountain Creek |
|
100.0 | 457.70 | 0.70 | 24,727 | 22,850 | 22,850 | 2,894 |
| Navarro Mills |
|
100.0 | 424.67 | 0.17 | 50,630 | 49,827 | 49,827 | - n.a. - |
| New Terrell City |
|
34.0 | 495.53 | -8.47 | 2,932 | 2,921 | 8,583 | 443 |
| Ray Hubbard |
|
100.0 | 435.59 | 0.09 | 441,450 | 439,559 | 439,559 | 21,061 |
| Ray Roberts |
|
100.0 | 634.30 | 1.80 | 840,598 | 788,167 | 788,167 | - n.a. - |
| Richland-Chambers |
|
96.6 | 314.15 | -0.85 | 1,088,196 | 1,062,413 | 1,099,417 | 43,195 |
| Waxahachie |
|
100.0 | 531.83 | 0.33 | 11,863 | 11,060 | 11,060 | 679 |
| Weatherford |
|
70.0 | 890.66 | -5.34 | 12,470 | 12,470 | 17,812 | 927 |
| Worth |
|
72.1 | 591.94 | -2.06 | 26,688 | 17,612 | 24,419 | 3,178 |