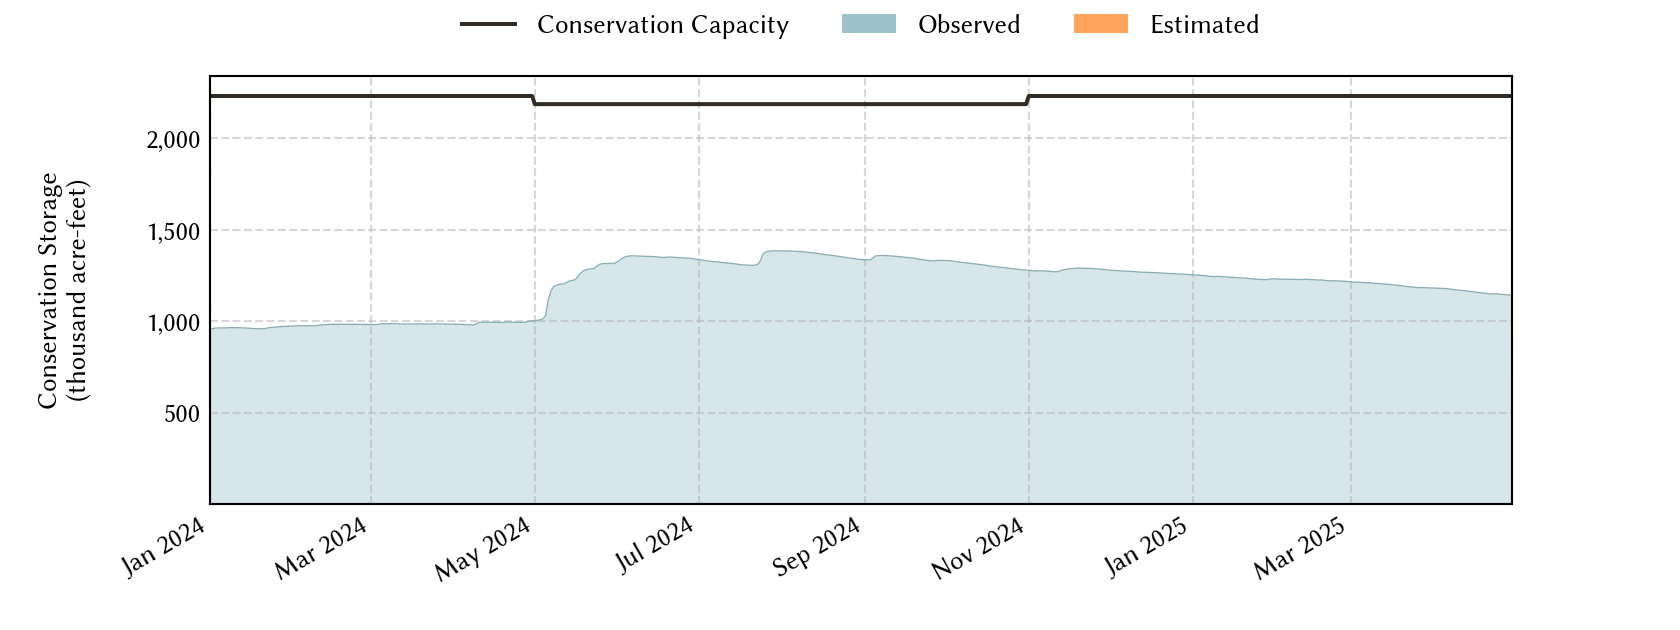
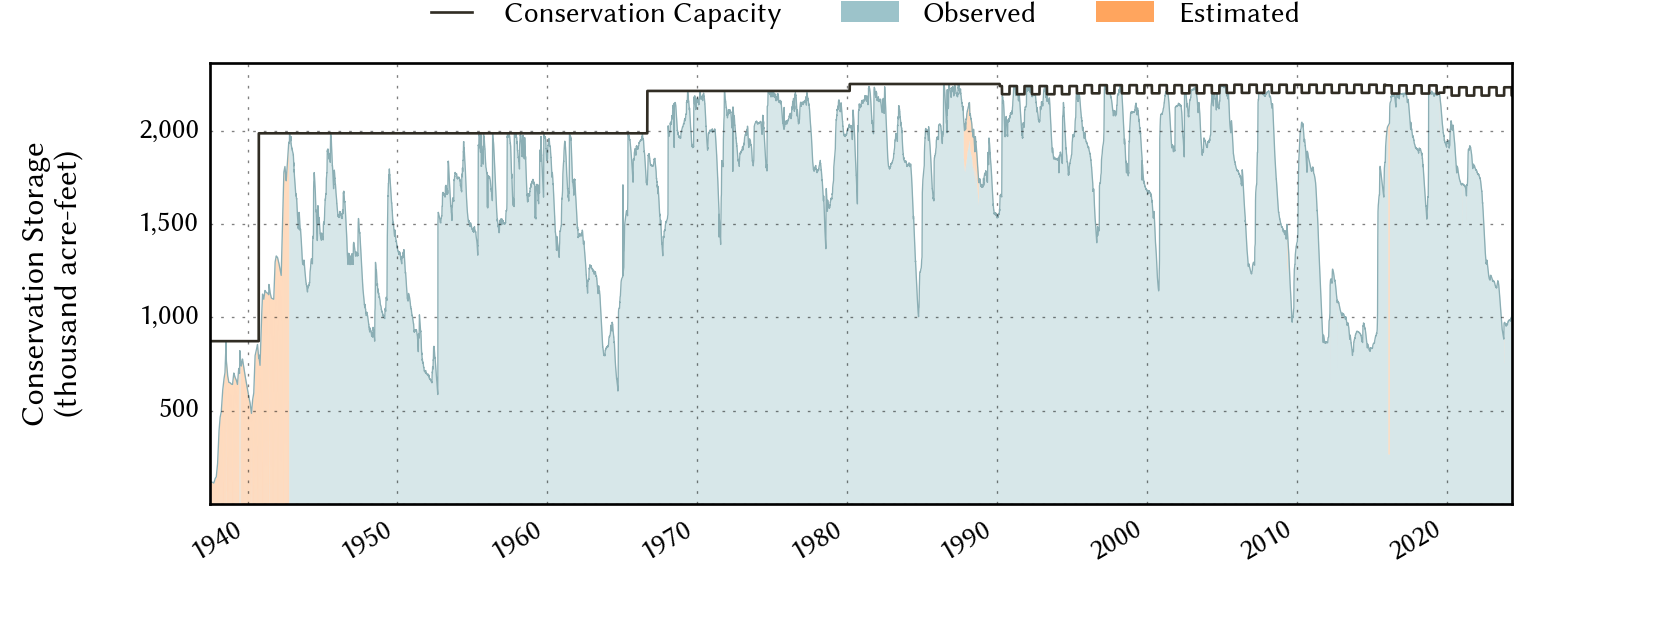
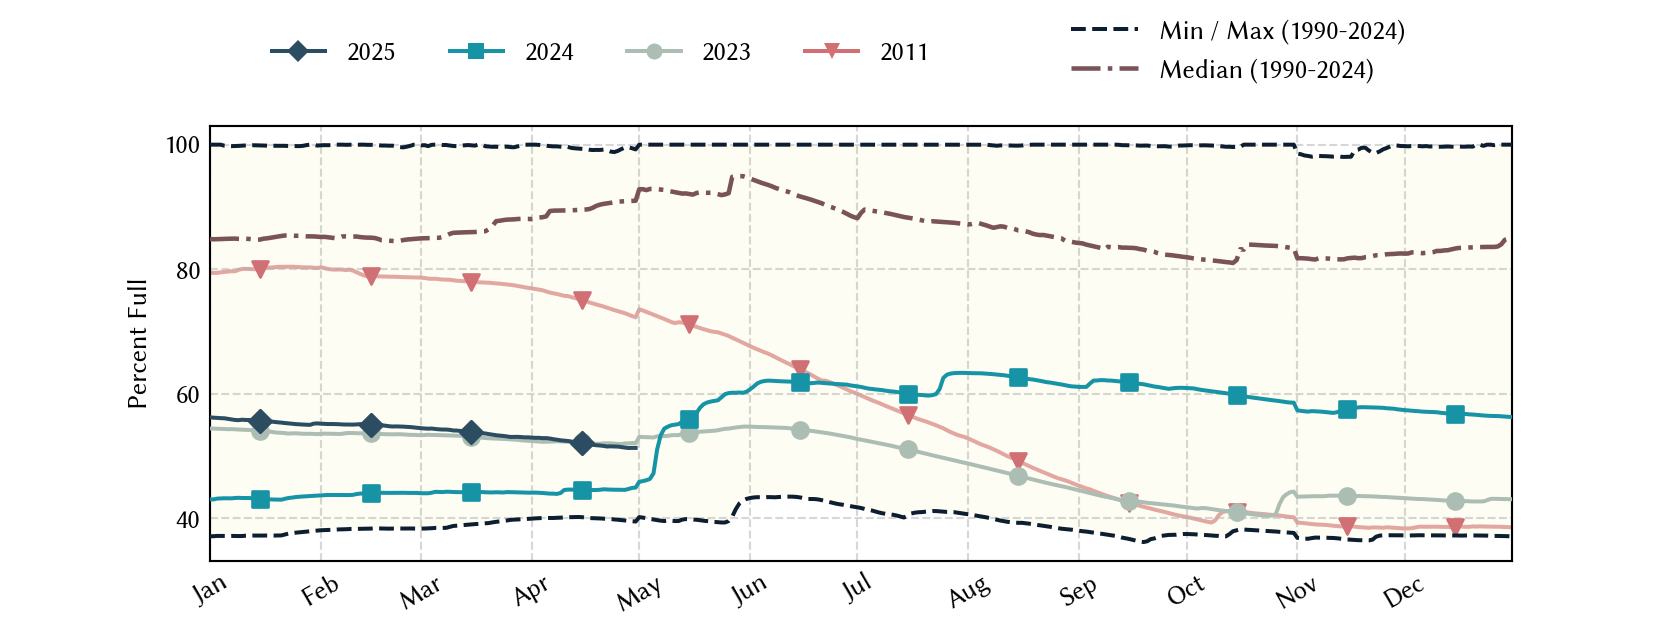
Austin Area Reservoirs: Monitored Water Supply Reservoirs are 92.9% full on 2026-06-29
Historical Data
| Date | Percent Full |
Reservoir Storage (acre-ft) |
Conservation Storage (acre-ft) |
Conservation Capacity (acre-ft) |
|
|---|---|---|---|---|---|
| Today | 2026-06-29 | 92.9 | 2,121,605 | 2,074,607 | 2,232,539 |
| Yesterday | 2026-06-28 | 93.0 | 2,124,061 | 2,076,475 | 2,232,539 |
| 2 days ago | 2026-06-27 | 93.1 | 2,127,355 | 2,078,857 | 2,232,539 |
| 1 week ago | 2026-06-22 | 93.0 | 2,130,465 | 2,077,337 | 2,232,539 |
| 1 month ago | 2026-05-29 | 90.8 | 2,101,139 | 2,026,985 | 2,232,539 |
| 3 months ago | 2026-03-29 | 83.9 | 1,904,847 | 1,874,004 | 2,232,539 |
| 6 months ago | 2025-12-29 | 87.4 | 1,981,007 | 1,950,164 | 2,232,539 |
| 1 year ago | 2025-06-29 | 55.7 | 1,274,487 | 1,243,644 | 2,232,539 |
*
Percent Full is based on Conservation Storage and Conservation Capacity and doesn't account for storage in flood pool.
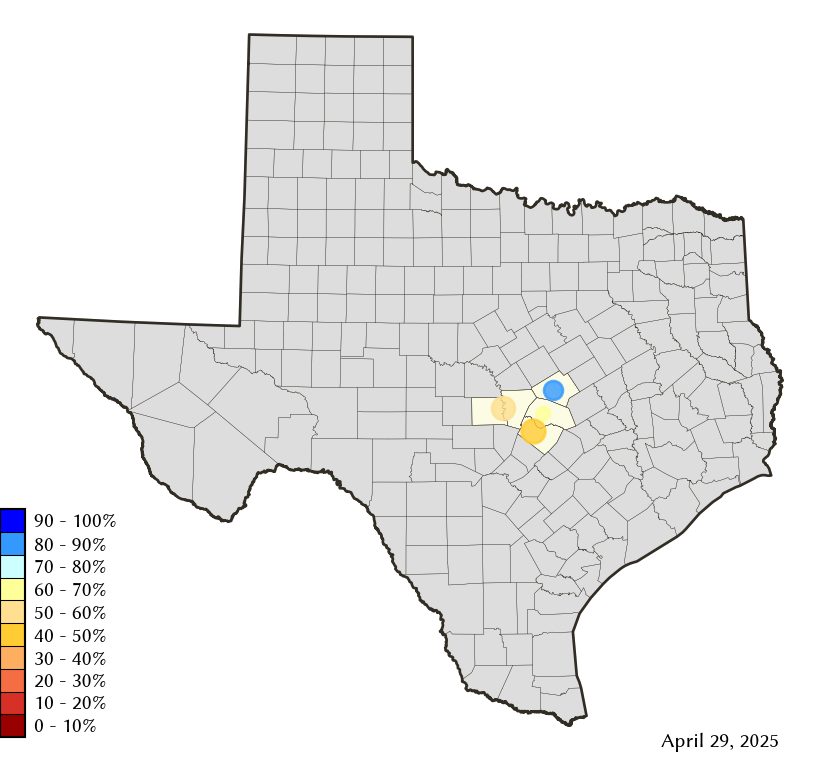
Area Map
Reservoir Storage
| Reservoir | Type | Percent Full |
Water Level (ft) |
Height Above Conservation Pool (ft) |
Reservoir Storage (acre-ft) |
Conservation Storage (acre-ft) |
Conservation Capacity (acre-ft) |
Surface Area (acres) |
|---|---|---|---|---|---|---|---|---|
| Buchanan |

|
99.9 | 1,019.96 | -0.04 | 879,458 | 865,796 | 866,694 | 22,442 |
| Georgetown |

|
100.0 | 794.16 | 3.16 | 42,350 | 38,005 | 38,005 | - n.a. - |
| Stillhouse Hollow |
|
100.0 | 623.79 | 1.79 | 241,622 | 229,796 | 229,796 | - n.a. - |
| Travis |
|
85.7 | 672.29 | -8.71 | 958,042 | 941,010 | 1,098,044 | 16,972 |