North-East-Texas Planning Region Reservoirs: Monitored Water Supply Reservoirs are 95.5% full on 2026-07-07
Historical Data
| Date | Percent Full |
Reservoir Storage (acre-ft) |
Conservation Storage (acre-ft) |
Conservation Capacity (acre-ft) |
|
|---|---|---|---|---|---|
| Today | 2026-07-07 | 95.5 | 2,954,150 | 2,474,372 | 2,592,091 |
| Yesterday | 2026-07-06 | 95.4 | 2,954,630 | 2,471,729 | 2,592,091 |
| 2 days ago | 2026-07-05 | 95.4 | 2,973,613 | 2,473,174 | 2,592,091 |
| 1 week ago | 2026-06-30 | 95.7 | 3,046,604 | 2,481,265 | 2,592,091 |
| 1 month ago | 2026-06-07 | 95.1 | 2,821,898 | 2,465,891 | 2,592,091 |
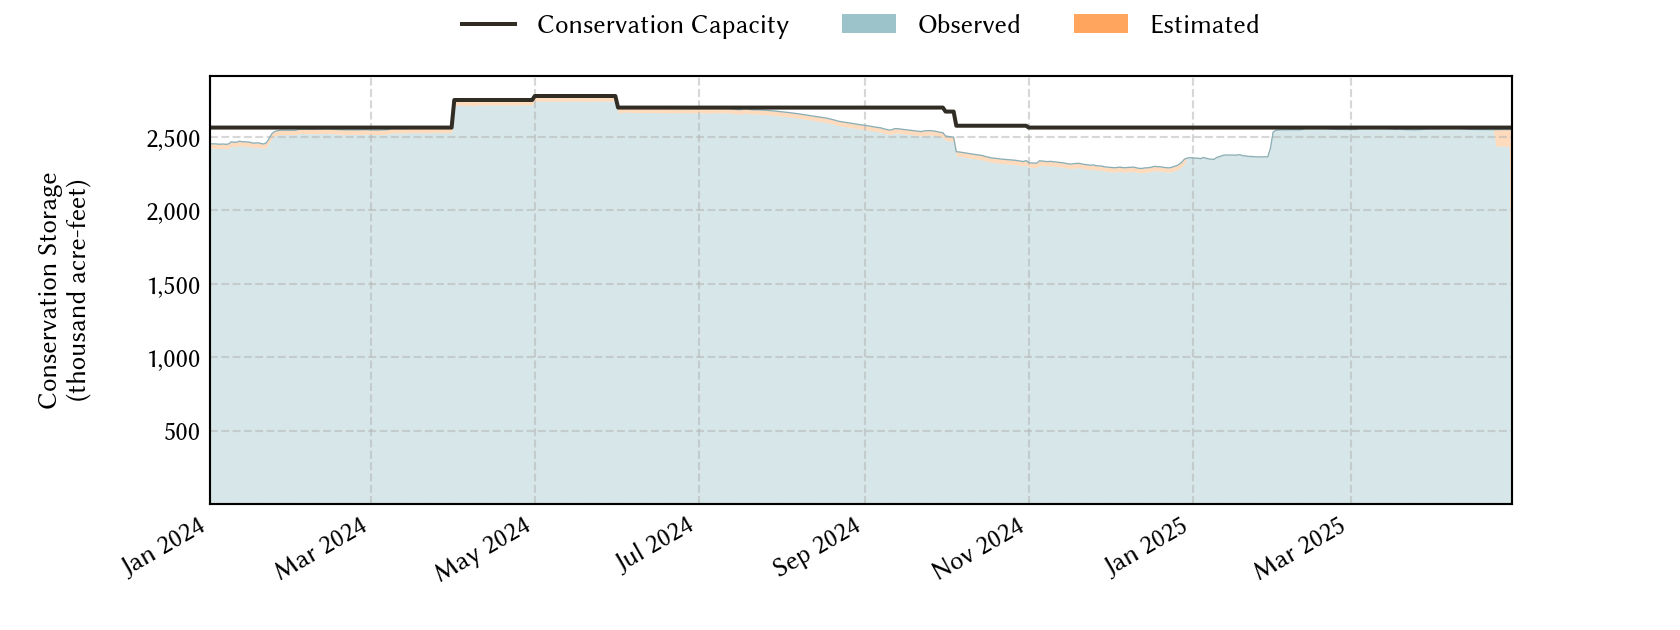
| 3 months ago | 2026-04-07 | 93.5 | 2,633,437 | 2,397,143 | 2,564,888 |
| 6 months ago | 2026-01-07 | 90.1 | 2,572,596 | 2,311,955 | 2,564,888 |
| 1 year ago | 2025-07-07 | 99.7 | 3,068,820 | 2,584,605 | 2,592,091 |
*
Percent Full is based on Conservation Storage and Conservation Capacity and doesn't account for storage in flood pool.
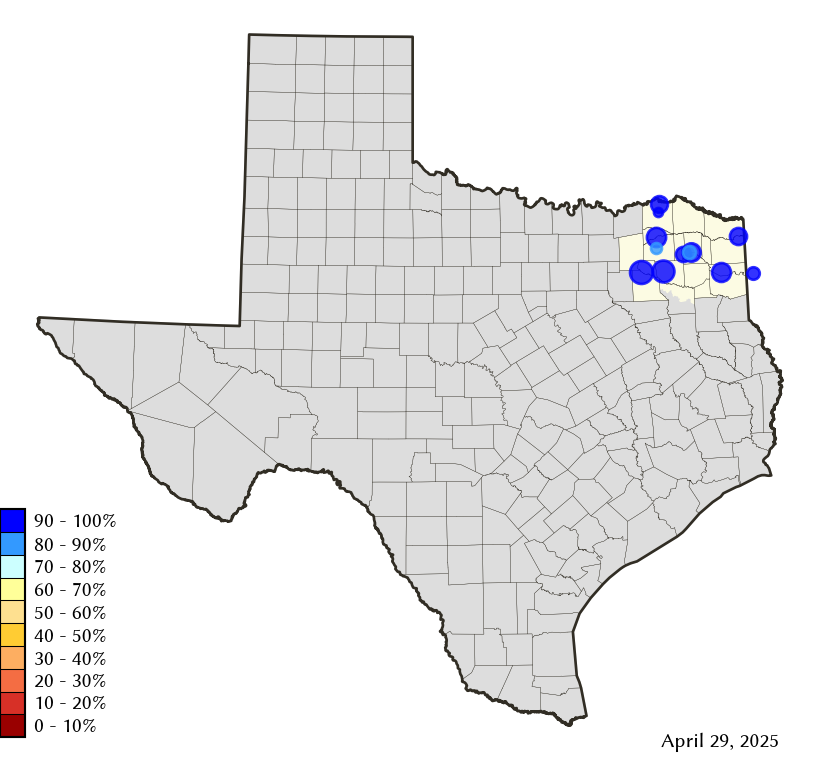
Area Map
Reservoir Storage
| Reservoir | Type | Percent Full |
Water Level (ft) |
Height Above Conservation Pool (ft) |
Reservoir Storage (acre-ft) |
Conservation Storage (acre-ft) |
Conservation Capacity (acre-ft) |
Surface Area (acres) |
|---|---|---|---|---|---|---|---|---|
| Bob Sandlin |

|
96.0 | 336.63 | -0.87 | 195,489 | 184,758 | 192,417 | 8,718 |
| Caddo 1 |
|
100.0 | 169.08 | 0.58 | 142,411 | 29,898 | 29,898 | 28,007 |
| Crook |
|
100.0 | 476.06 | 0.06 | 9,273 | 9,195 | 9,195 | - n.a. - |
| Cypress Springs |
|
97.1 | 377.40 | -0.60 | 64,829 | 64,829 | 66,756 | 3,188 |
| Fork |
|
90.8 | 400.86 | -2.14 | 582,069 | 550,626 | 606,088 | 24,945 |
| Jim Chapman |

|
88.4 | 438.29 | -1.71 | 264,562 | 228,787 | 258,723 | 17,014 |
| Lake O' the Pines |
|
94.1 | 229.14 | -0.86 | 252,786 | 252,786 | 268,566 | - n.a. - |
| Monticello |
|
80.9 | 336.48 | -3.52 | 28,113 | 28,113 | 34,740 | 1,682 |
| Pat Mayse |
|
100.0 | 452.88 | 1.88 | 128,634 | 113,683 | 113,683 | - n.a. - |
| Sulphur Springs |
|
98.2 | 458.77 | -0.18 | 17,419 | 17,419 | 17,747 | - n.a. - |
| Tawakoni |
|
100.0 | 437.50 | 0.00 | 871,693 | 871,685 | 871,685 | 37,325 |
| Wright Patman |
|
100.0 | 229.88 | 9.28 | 396,872 | 122,593 | 122,593 | - n.a. - |
footnotes
1
Caddo Lake straddles the border of Texas and Louisiana, Texas has rights to 50% of Lake Caddo's total conservation capacity. Percent full, conservation storage and conservation capacity are based on the Texas share.