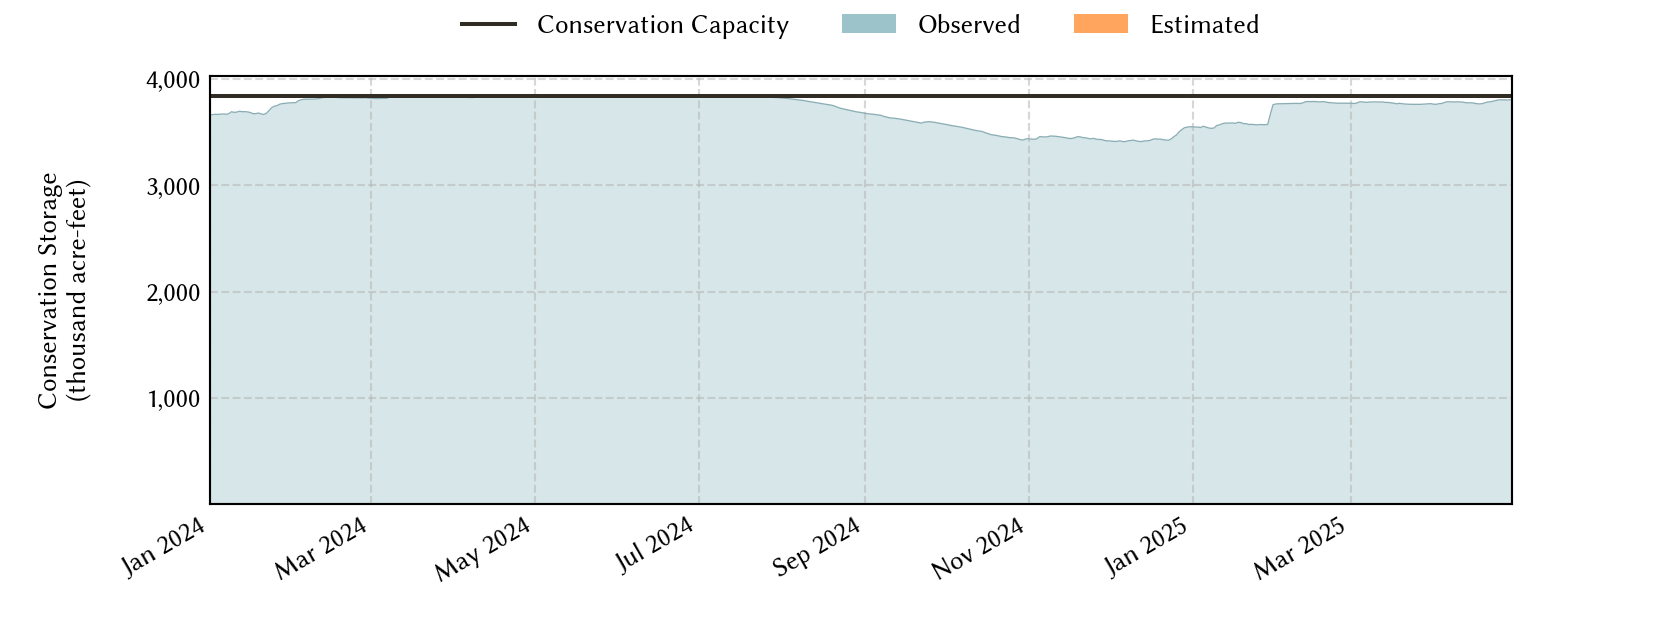
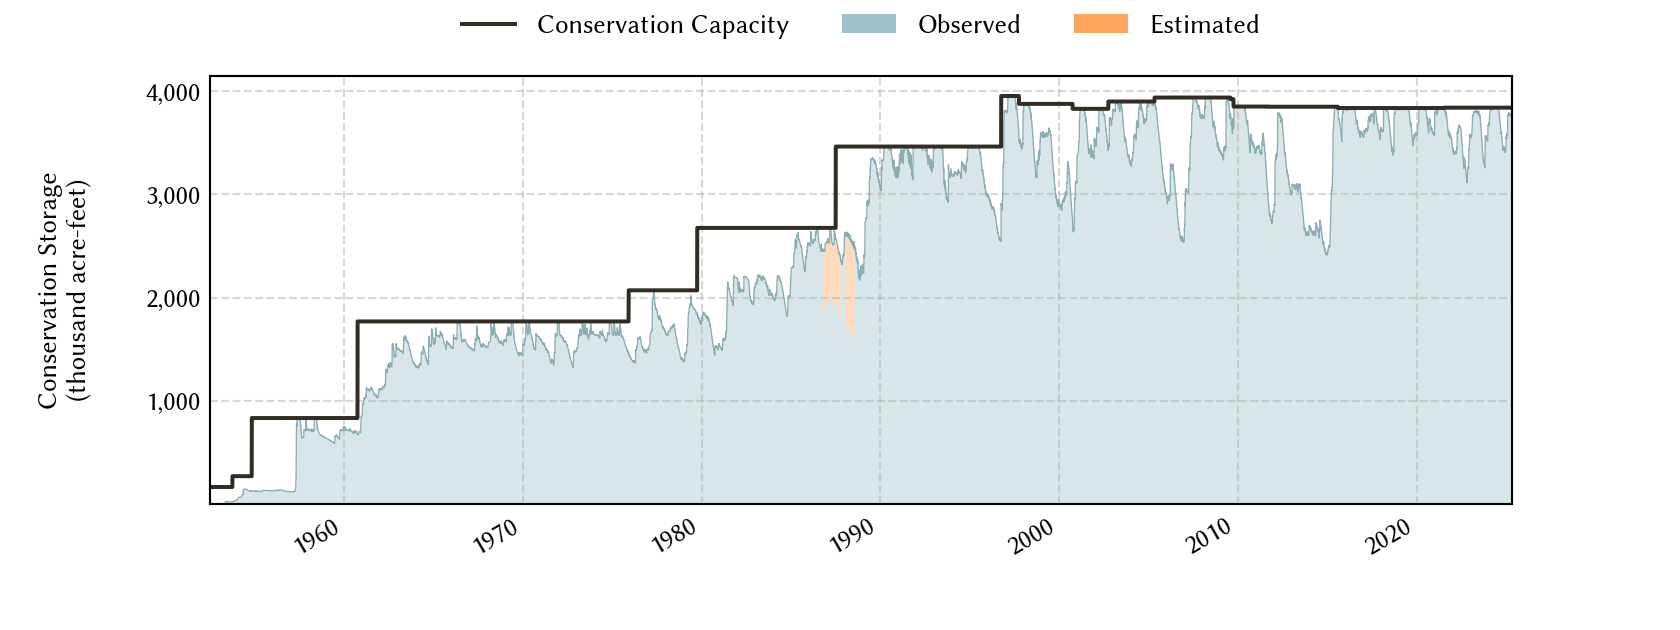
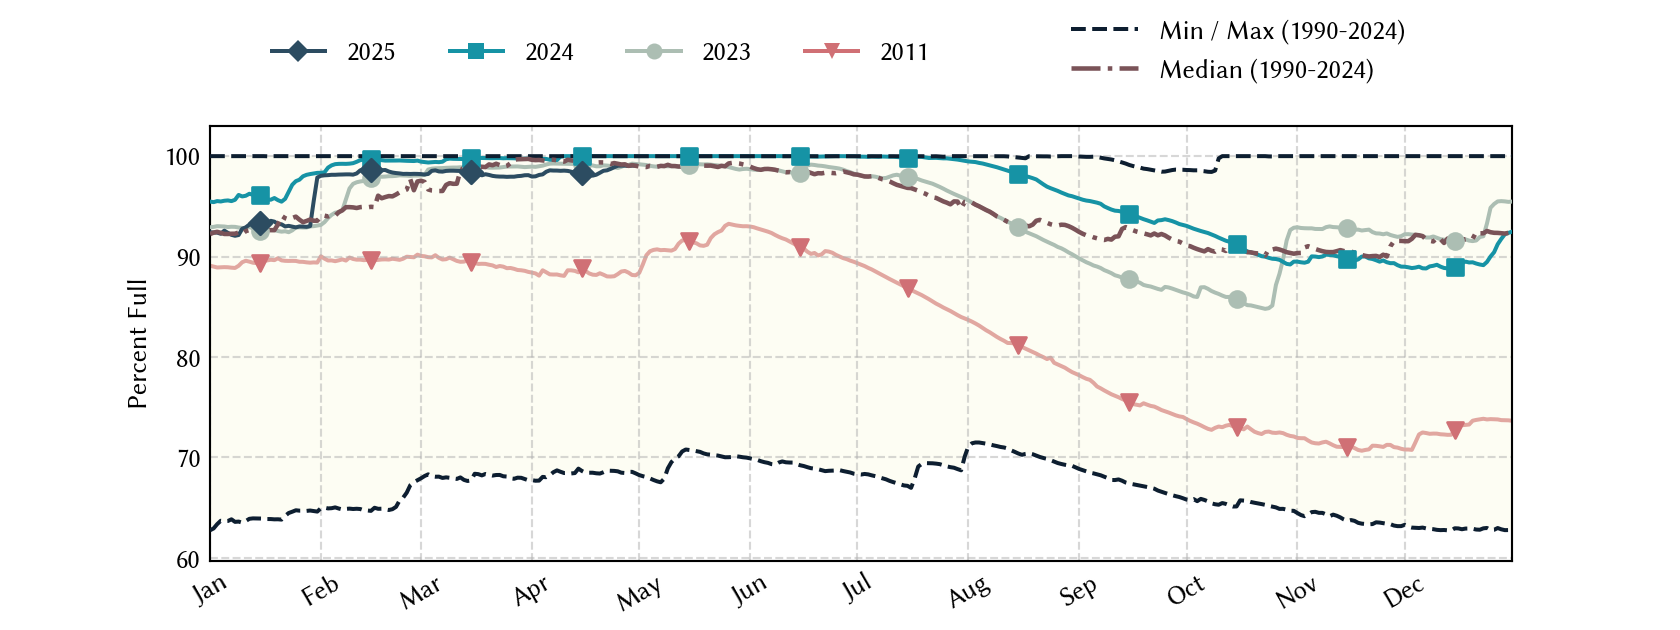
Dallas Area Reservoirs: Monitored Water Supply Reservoirs are 98.6% full on 2026-07-02
Historical Data
| Date | Percent Full |
Reservoir Storage (acre-ft) |
Conservation Storage (acre-ft) |
Conservation Capacity (acre-ft) |
|
|---|---|---|---|---|---|
| Most recent | 2026-07-02 | 98.6 | 3,919,885 | 3,786,163 | 3,841,548 |
| 1 day prior | 2026-07-01 | 98.6 | 3,928,135 | 3,787,082 | 3,841,548 |
| 2 days prior | 2026-06-30 | 98.6 | 3,940,124 | 3,788,459 | 3,841,548 |
| 1 week prior | 2026-06-25 | 98.7 | 4,022,316 | 3,793,358 | 3,841,548 |
| 1 month prior | 2026-06-02 | 98.7 | 3,905,869 | 3,790,089 | 3,841,548 |
| 3 months prior | 2026-04-02 | 96.8 | 3,792,939 | 3,719,242 | 3,841,548 |
| 6 months prior | 2026-01-02 | 93.5 | 3,663,431 | 3,593,142 | 3,841,548 |
| 1 year prior | 2025-07-02 | 99.9 | 3,983,466 | 3,839,252 | 3,841,548 |
*
Percent Full is based on Conservation Storage and Conservation Capacity and doesn't account for storage in flood pool.
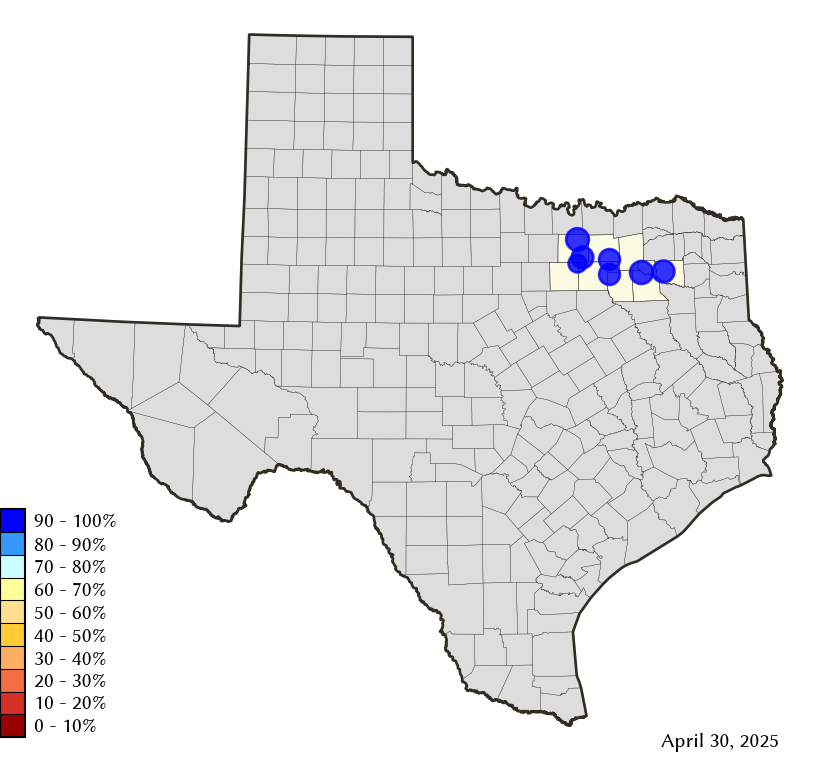
Area Map
Reservoir Storage
| Reservoir | Type | Percent Full |
Water Level (ft) |
Height Above Conservation Pool (ft) |
Reservoir Storage (acre-ft) |
Conservation Storage (acre-ft) |
Conservation Capacity (acre-ft) |
Surface Area (acres) |
|---|---|---|---|---|---|---|---|---|
| Fork |

|
91.1 | 400.93 | -2.07 | 583,817 | 552,374 | 606,088 | 25,009 |
| Grapevine |

|
100.0 | 535.33 | 0.33 | 165,254 | 163,064 | 163,064 | - n.a. - |
| Lavon |
|
100.0 | 492.46 | 0.46 | 422,155 | 409,757 | 409,757 | 20,908 |
| Lewisville |
|
100.0 | 523.04 | 1.04 | 627,368 | 563,228 | 563,228 | - n.a. - |
| Ray Hubbard |
|
99.6 | 435.42 | -0.08 | 437,888 | 437,888 | 439,559 | 20,847 |
| Ray Roberts |
|
100.0 | 633.17 | 0.67 | 807,639 | 788,167 | 788,167 | - n.a. - |
| Tawakoni |
|
100.0 | 437.61 | 0.11 | 875,764 | 871,685 | 871,685 | - n.a. - |