San-Antonio River Basin Reservoirs: Monitored Water Supply Reservoirs are 29.5% full on 2026-07-31
Historical Data
| Date | Percent Full |
Reservoir Storage (acre-ft) |
Conservation Storage (acre-ft) |
Conservation Capacity (acre-ft) |
|
|---|---|---|---|---|---|
| Today | 2026-07-31 | 29.5 | 75,080 | 75,080 | 254,823 |
| Yesterday | 2026-07-30 | 29.4 | 74,904 | 74,904 | 254,823 |
| 2 days ago | 2026-07-29 | 29.3 | 74,654 | 74,654 | 254,823 |
| 1 week ago | 2026-07-24 | 28.5 | 72,655 | 72,655 | 254,823 |
| 1 month ago | 2026-06-30 | 9.0 | 23,003 | 23,003 | 254,823 |
| 3 months ago | 2026-04-30 | 3.9 | 9,819 | 9,819 | 254,823 |
| 6 months ago | 2026-01-31 | 4.4 | 11,299 | 11,299 | 254,823 |
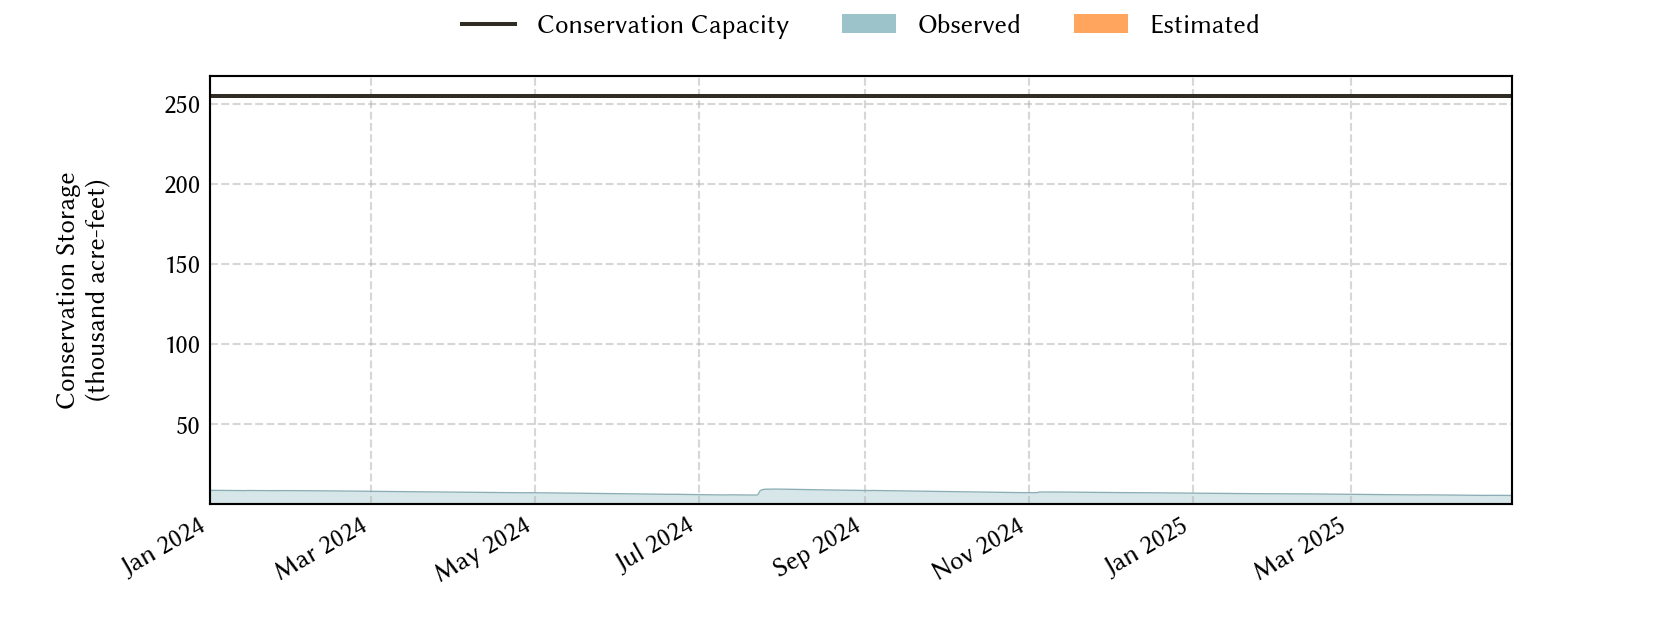
| 1 year ago | 2025-07-31 | 6.5 | 16,459 | 16,459 | 254,823 |
*
Percent Full is based on Conservation Storage and Conservation Capacity and doesn't account for storage in flood pool.
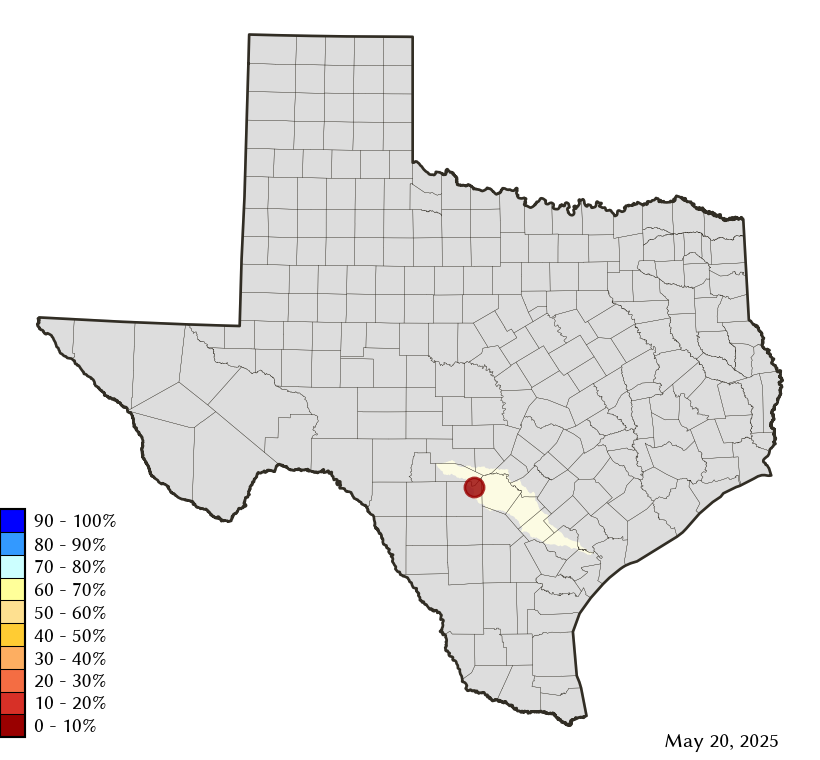
Area Map
Reservoir Storage
| Reservoir | Type | Percent Full |
Water Level (ft) |
Height Above Conservation Pool (ft) |
Reservoir Storage (acre-ft) |
Conservation Storage (acre-ft) |
Conservation Capacity (acre-ft) |
Surface Area (acres) |
|---|---|---|---|---|---|---|---|---|
| Medina |

|
29.5 | 1,021.47 | -42.73 | 75,080 | 75,080 | 254,823 | 2,508 |