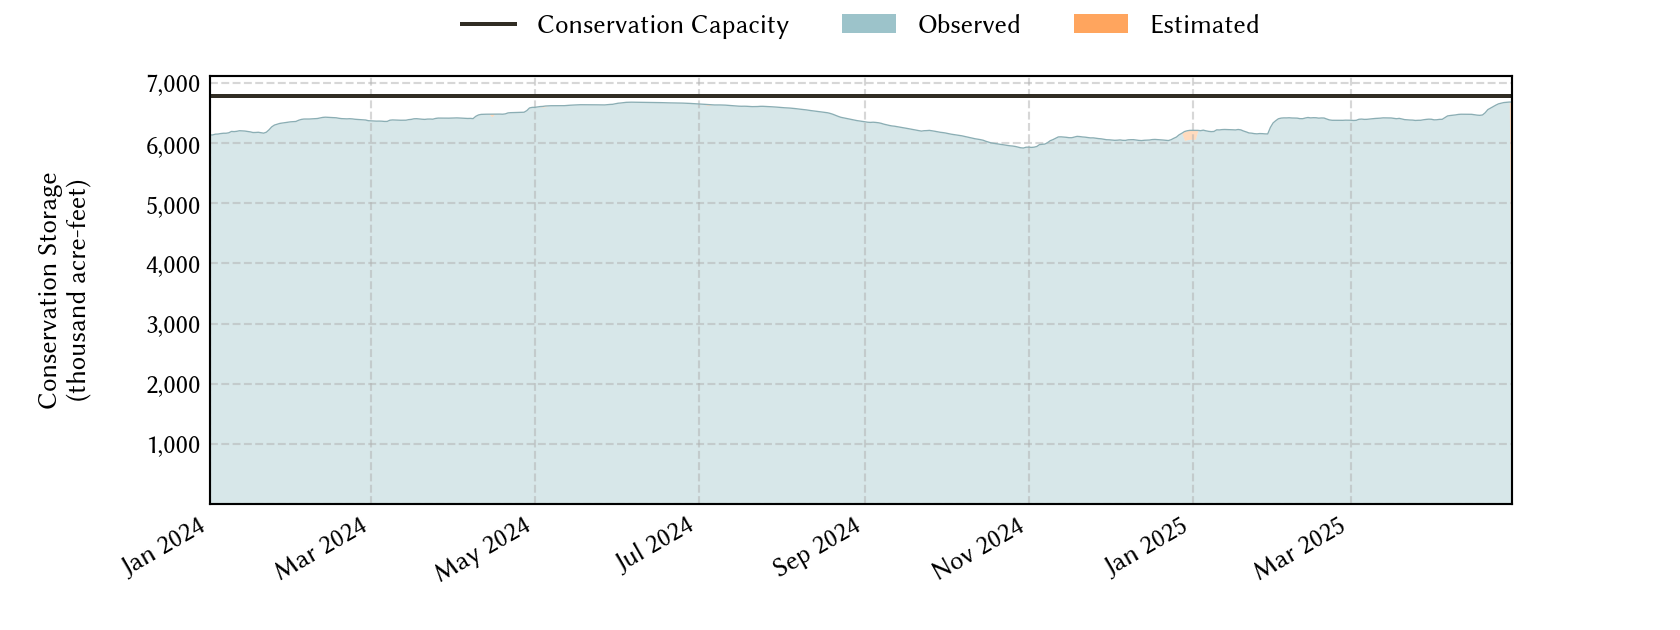
Region-C Planning Region Reservoirs: Monitored Water Supply Reservoirs are 96.0% full on 2026-07-13
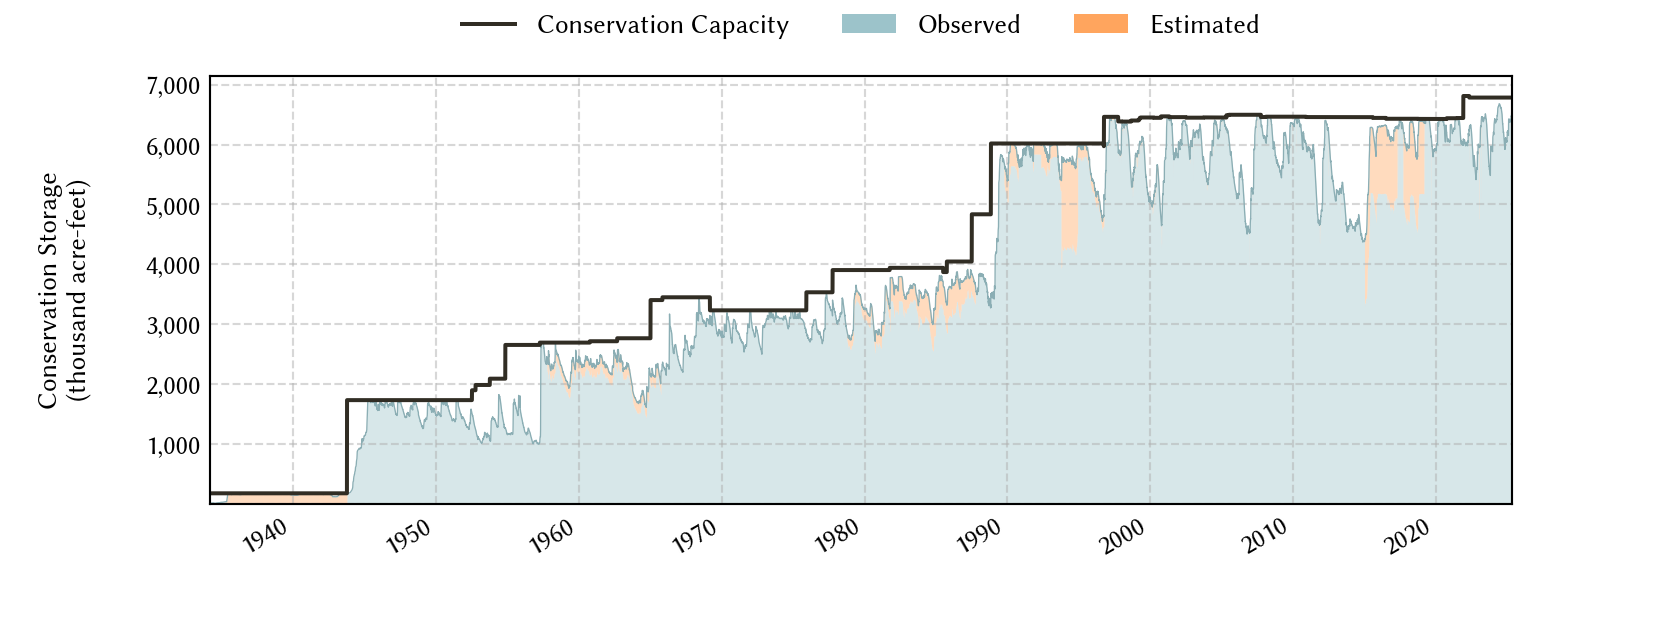
Historical Data
| Date | Percent Full |
Reservoir Storage (acre-ft) |
Conservation Storage (acre-ft) |
Conservation Capacity (acre-ft) |
|
|---|---|---|---|---|---|
| Today | 2026-07-13 | 96.0 | 7,993,649 | 6,515,349 | 6,783,467 |
| Yesterday | 2026-07-12 | 95.8 | 7,973,764 | 6,501,376 | 6,783,467 |
| 2 days ago | 2026-07-11 | 95.9 | 7,981,440 | 6,504,949 | 6,783,467 |
| 1 week ago | 2026-07-06 | 96.3 | 8,050,001 | 6,530,953 | 6,783,467 |
| 1 month ago | 2026-06-13 | 96.7 | 8,177,259 | 6,562,016 | 6,783,467 |
| 3 months ago | 2026-04-13 | 94.7 | 7,771,124 | 6,423,101 | 6,783,467 |
| 6 months ago | 2026-01-13 | 92.7 | 7,607,043 | 6,287,790 | 6,783,467 |
| 1 year ago | 2025-07-13 | 99.6 | 8,260,802 | 6,758,180 | 6,783,467 |
*
Percent Full is based on Conservation Storage and Conservation Capacity and doesn't account for storage in flood pool.
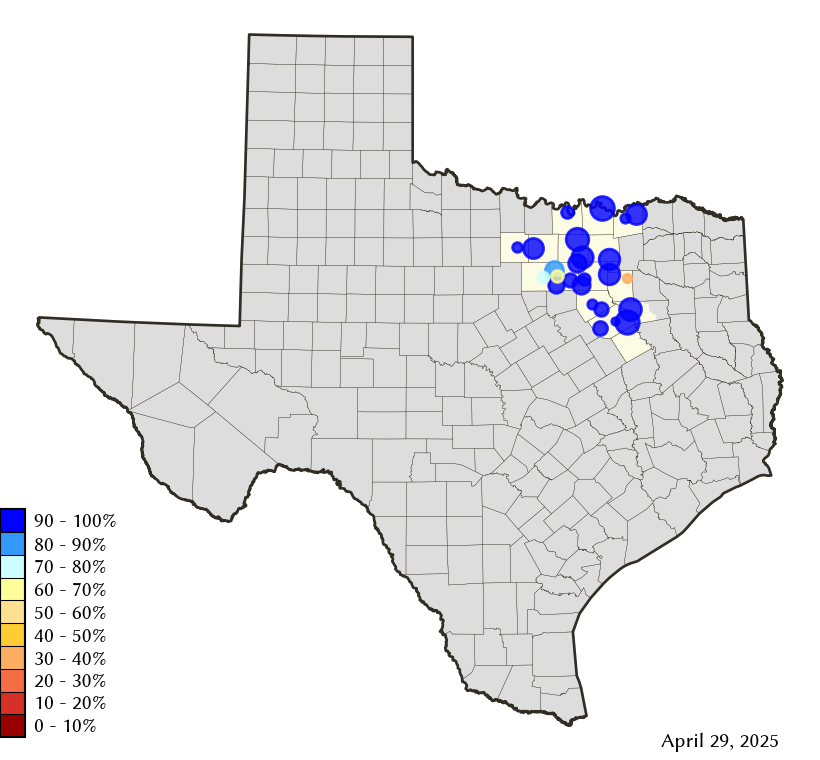
Area Map
Reservoir Storage
| Reservoir | Type | Percent Full |
Water Level (ft) |
Height Above Conservation Pool (ft) |
Reservoir Storage (acre-ft) |
Conservation Storage (acre-ft) |
Conservation Capacity (acre-ft) |
Surface Area (acres) |
|---|---|---|---|---|---|---|---|---|
| Arlington |

|
88.1 | 547.47 | -2.53 | 35,401 | 35,369 | 40,157 | 1,865 |
| Bardwell |

|
100.0 | 421.03 | 0.03 | 44,017 | 43,856 | 43,856 | 3,309 |
| Benbrook |
|
94.1 | 692.60 | -1.40 | 80,620 | 80,620 | 85,648 | 3,513 |
| Bois d'Arc |
|
100.0 | 534.05 | 0.05 | 368,460 | 367,609 | 367,609 | 16,549 |
| Bonham |
|
97.0 | 564.68 | -0.32 | 10,704 | 10,692 | 11,027 | 1,037 |
| Bridgeport |
|
86.4 | 831.69 | -4.31 | 321,405 | 321,405 | 372,183 | 11,310 |
| Cedar Creek |
|
83.3 | 318.53 | -3.47 | 537,290 | 537,191 | 644,686 | 29,432 |
| Eagle Mountain |
|
87.0 | 646.36 | -2.74 | 160,963 | 160,963 | 185,087 | 8,407 |
| Grapevine |
|
100.0 | 535.22 | 0.22 | 164,521 | 163,064 | 163,064 | - n.a. - |
| Halbert |
|
80.4 | 365.86 | -2.14 | 4,850 | 4,850 | 6,033 | 528 |
| Hubert H Moss |
|
97.6 | 714.47 | -0.53 | 23,586 | 23,489 | 24,058 | 1,067 |
| Joe Pool |
|
99.2 | 521.82 | -0.18 | 149,800 | 148,430 | 149,629 | 6,642 |
| Lavon |
|
100.0 | 492.14 | 0.14 | 415,490 | 409,757 | 409,757 | 20,697 |
| Lewisville |
|
100.0 | 522.36 | 0.36 | 608,670 | 563,228 | 563,228 | - n.a. - |
| Lost Creek |
|
93.9 | 1,007.70 | -1.80 | 11,221 | 11,221 | 11,950 | - n.a. - |
| Mountain Creek |
|
100.0 | 457.34 | 0.34 | 23,665 | 22,850 | 22,850 | 2,777 |
| Navarro Mills |
|
95.8 | 424.05 | -0.45 | 47,731 | 47,730 | 49,827 | 4,613 |
| New Terrell City |
|
31.5 | 495.03 | -8.97 | 2,716 | 2,705 | 8,583 | 419 |
| Ray Hubbard |
|
99.0 | 435.28 | -0.22 | 434,981 | 434,981 | 439,559 | 20,683 |
| Ray Roberts |
|
100.0 | 632.74 | 0.24 | 795,316 | 788,167 | 788,167 | - n.a. - |
| Richland-Chambers |
|
95.7 | 313.91 | -1.09 | 1,077,851 | 1,052,068 | 1,099,417 | 43,003 |
| Texoma 1 |
|
100.0 | 618.74 | 1.74 | 2,623,430 | 1,243,801 | 1,243,801 | 83,583 |
| Waxahachie |
|
97.3 | 531.04 | -0.46 | 11,342 | 10,760 | 11,060 | 649 |
| Weatherford |
|
65.6 | 889.80 | -6.20 | 11,682 | 11,682 | 17,812 | 907 |
| Worth |
|
77.2 | 592.33 | -1.67 | 27,937 | 18,861 | 24,419 | 3,228 |
footnotes
1
Lake Texoma straddles the border of Texas and Oklahoma, Texas has rights to 50% of Lake Texoma's total conservation capacity. Percent full, conservation storage and conservation capacity are based on the Texas share.