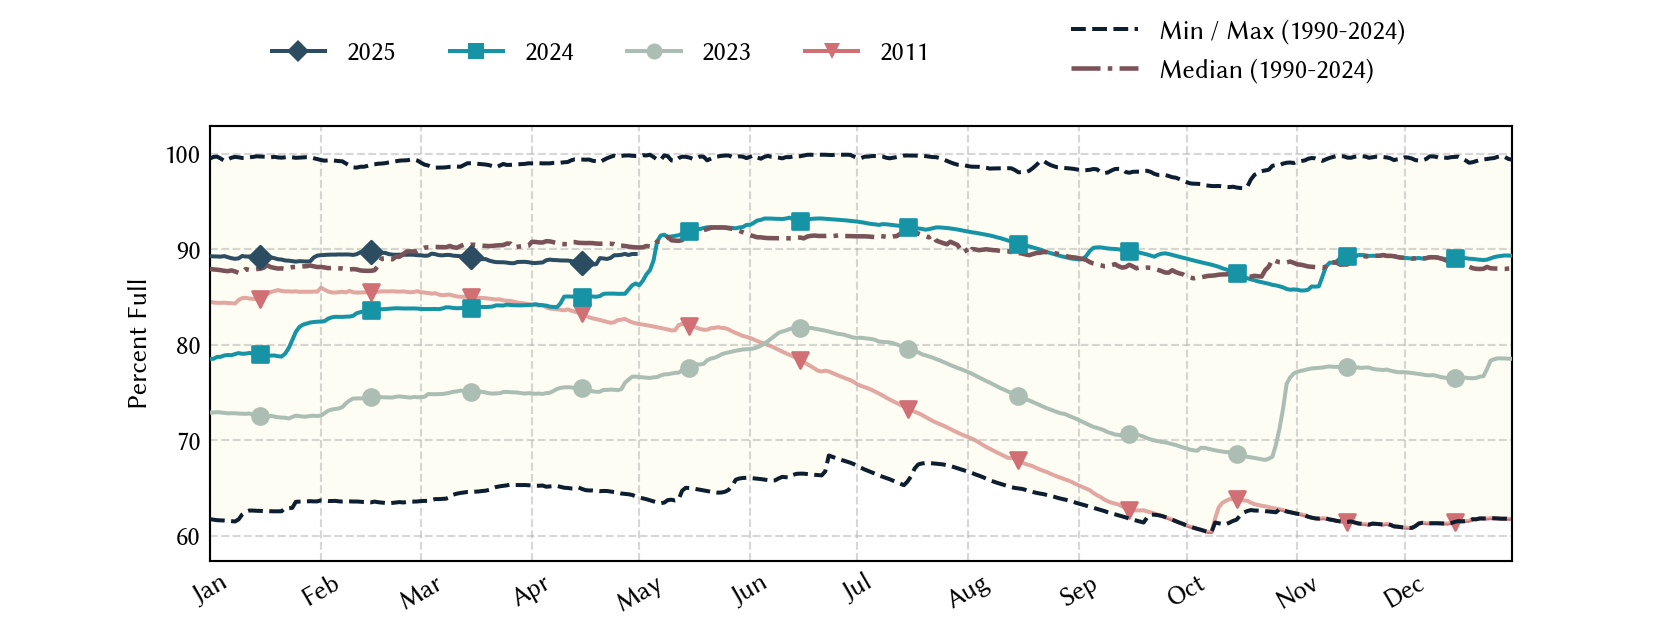
Brazos-G Planning Region Reservoirs: Monitored Water Supply Reservoirs are 89.7% full on 2026-07-31
Historical Data
| Date | Percent Full |
Reservoir Storage (acre-ft) |
Conservation Storage (acre-ft) |
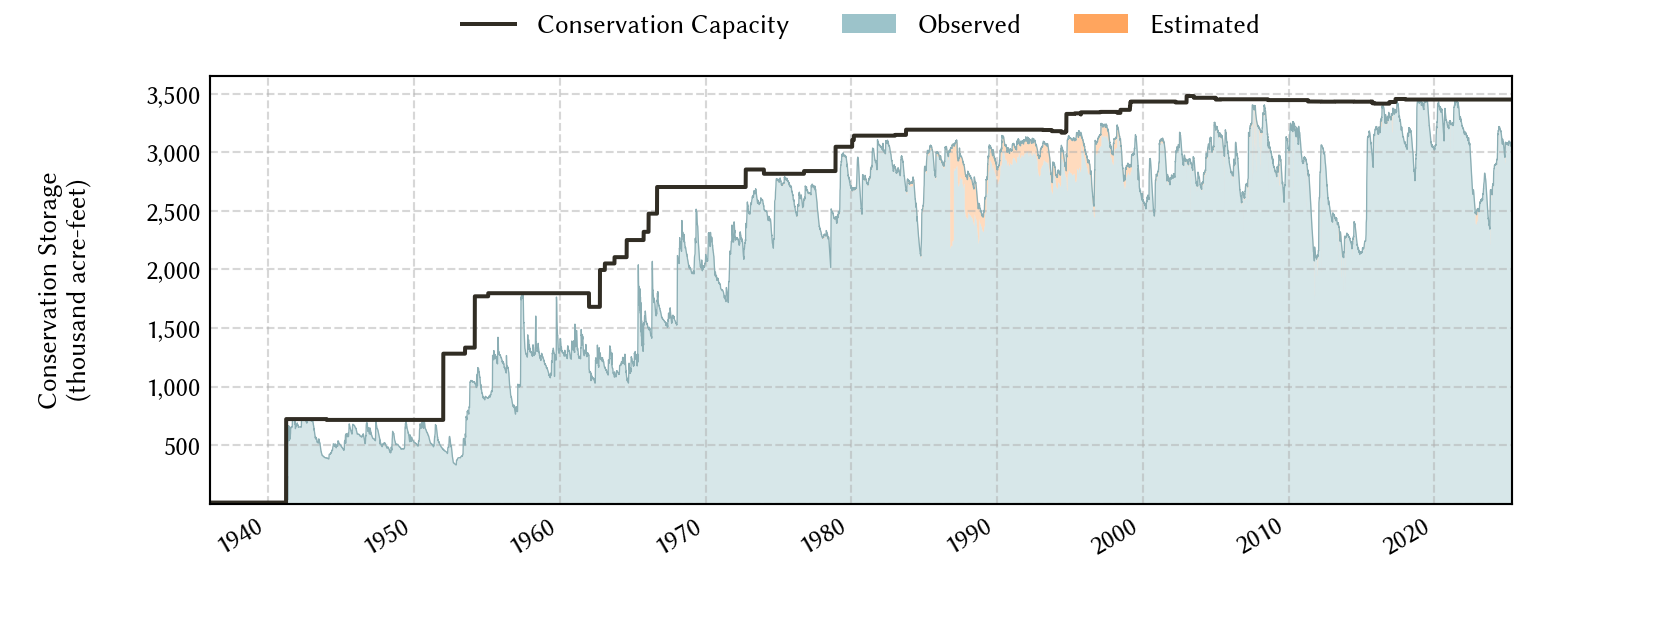
Conservation Capacity (acre-ft) |
|
|---|---|---|---|---|---|
| Today | 2026-07-31 | 89.7 | 3,139,421 | 3,093,957 | 3,448,023 |
| Yesterday | 2026-07-30 | 89.8 | 3,145,233 | 3,097,345 | 3,448,023 |
| 2 days ago | 2026-07-29 | 89.9 | 3,151,884 | 3,101,134 | 3,448,023 |
| 1 week ago | 2026-07-24 | 90.4 | 3,183,820 | 3,116,378 | 3,448,023 |
| 1 month ago | 2026-06-30 | 90.6 | 3,195,554 | 3,125,372 | 3,448,023 |
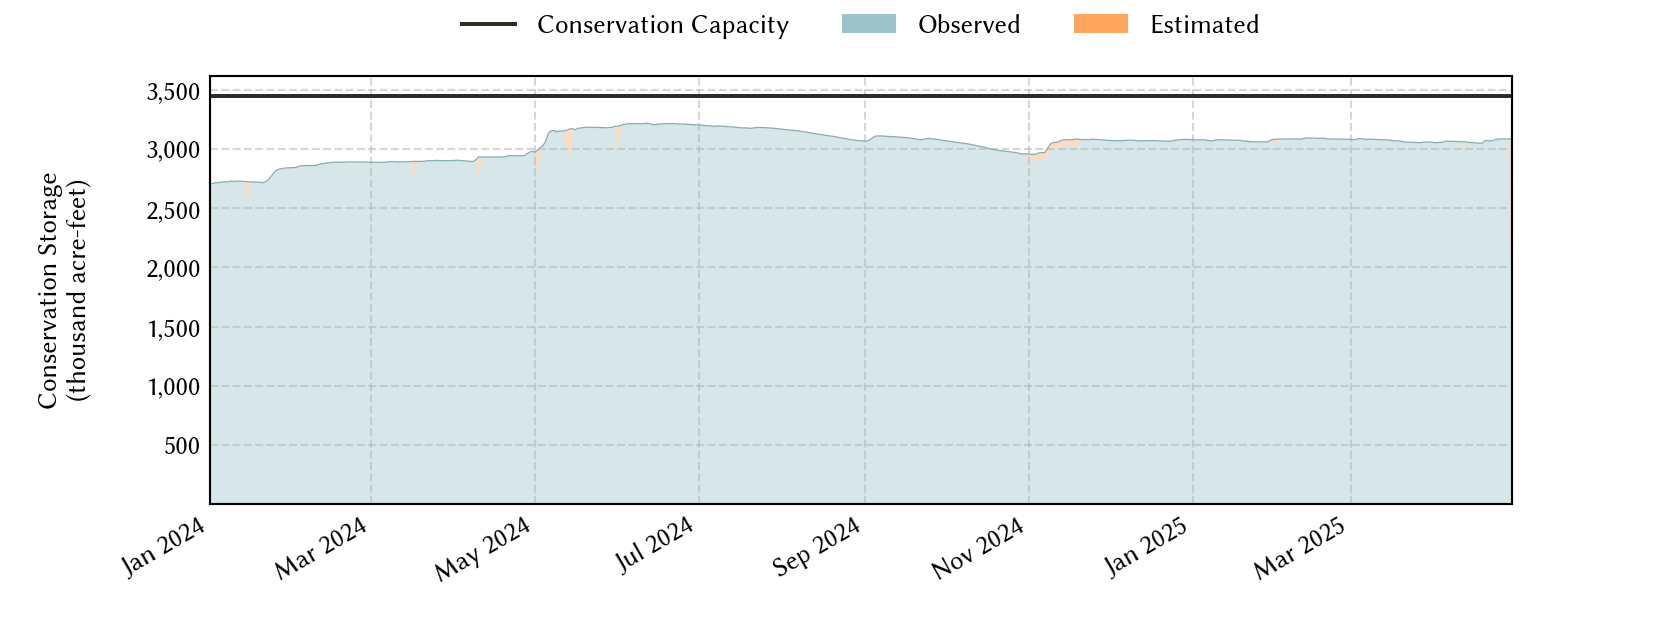
| 3 months ago | 2026-04-30 | 88.7 | 3,081,516 | 3,057,224 | 3,448,023 |
| 6 months ago | 2026-01-31 | 86.7 | 2,999,935 | 2,988,280 | 3,448,023 |
| 1 year ago | 2025-07-31 | 93.9 | 3,340,138 | 3,236,840 | 3,448,023 |
*
Percent Full is based on Conservation Storage and Conservation Capacity and doesn't account for storage in flood pool.
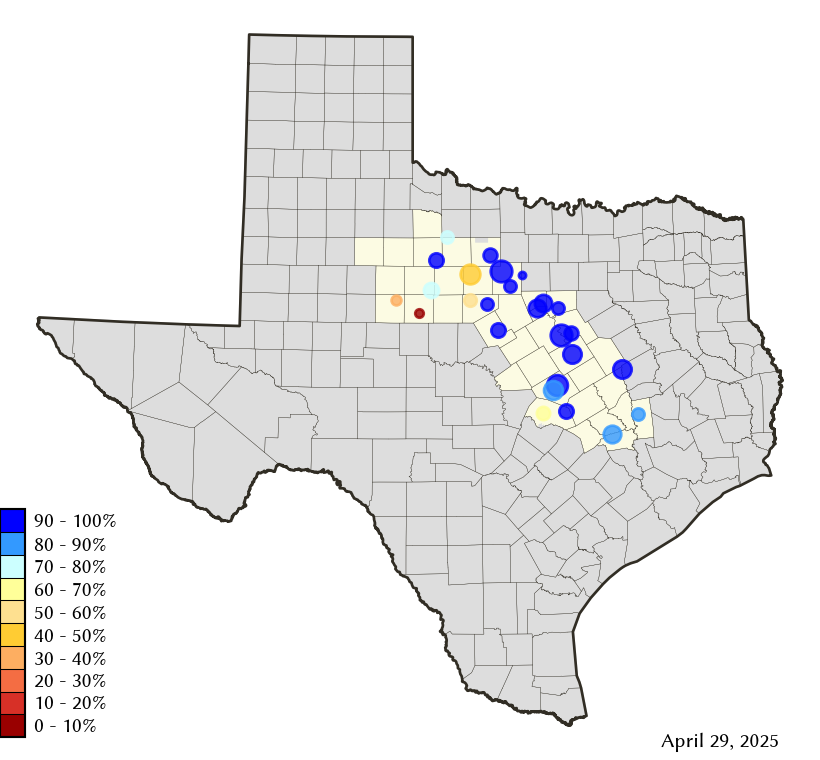
Area Map
Reservoir Storage
| Reservoir | Type | Percent Full |
Water Level (ft) |
Height Above Conservation Pool (ft) |
Reservoir Storage (acre-ft) |
Conservation Storage (acre-ft) |
Conservation Capacity (acre-ft) |
Surface Area (acres) |
|---|---|---|---|---|---|---|---|---|
| Abilene |

|
12.8 | 1,994.19 | -18.11 | 1,011 | 1,011 | 7,900 | 175 |
| Aquilla |

|
99.1 | 537.38 | -0.12 | 42,909 | 42,873 | 43,243 | 3,071 |
| Belton |
|
100.0 | 594.75 | 0.75 | 442,038 | 432,631 | 432,631 | - n.a. - |
| Cisco |
|
45.2 | 1,504.35 | -18.11 | 13,102 | 13,102 | 29,003 | 609 |
| Comanche Creek |
|
100.0 | 775.33 | 0.33 | 152,320 | 151,250 | 151,250 | - n.a. - |
| Fort Phantom Hill |
|
75.0 | 1,630.95 | -4.95 | 52,528 | 52,522 | 70,030 | 3,174 |
| Georgetown |
|
100.0 | 791.48 | 0.48 | 38,699 | 38,005 | 38,005 | - n.a. - |
| Gibbons Creek |
|
96.2 | 246.61 | -0.39 | 26,438 | 24,734 | 25,721 | 2,510 |
| Graham |
|
73.3 | 1,069.70 | -5.30 | 33,193 | 33,179 | 45,288 | 2,061 |
| Granbury |
|
92.9 | 691.52 | -1.18 | 124,469 | 123,560 | 132,949 | 7,742 |
| Granger |
|
100.0 | 505.40 | 1.40 | 57,784 | 51,822 | 51,822 | - n.a. - |
| Hubbard Creek |
|
40.6 | 1,167.83 | -15.48 | 132,114 | 127,238 | 313,298 | 8,622 |
| Leon |
|
84.5 | 1,372.39 | -2.61 | 23,727 | 23,447 | 27,762 | 1,551 |
| Limestone |
|
95.6 | 362.27 | -0.73 | 194,816 | 194,816 | 203,780 | 12,155 |
| Millers Creek |
|
66.2 | 1,329.17 | -4.83 | 18,993 | 17,710 | 26,768 | 1,528 |
| Mineral Wells |
|
96.3 | 862.58 | -0.42 | 5,079 | 5,079 | 5,273 | 456 |
| Palo Pinto |
|
91.0 | 865.88 | -1.12 | 24,742 | 24,356 | 26,766 | 2,130 |
| Pat Cleburne |
|
94.3 | 732.54 | -0.96 | 24,520 | 24,520 | 26,008 | 1,536 |
| Possum Kingdom |
|
93.5 | 997.01 | -1.99 | 503,397 | 503,397 | 538,139 | 16,996 |
| Proctor |
|
78.9 | 1,159.37 | -2.63 | 43,194 | 43,194 | 54,762 | 4,128 |
| Somerville |
|
100.0 | 239.14 | 1.14 | 163,447 | 150,293 | 150,293 | - n.a. - |
| Stamford |
|
74.3 | 1,414.16 | -2.64 | 38,302 | 38,299 | 51,570 | 4,118 |
| Stillhouse Hollow |
|
100.0 | 622.62 | 0.62 | 233,896 | 229,796 | 229,796 | - n.a. - |
| Sweetwater |
|
19.5 | 2,092.14 | -24.36 | 2,389 | 2,389 | 12,267 | 222 |
| Waco |
|
97.3 | 461.62 | -0.60 | 184,085 | 183,859 | 188,891 | 8,334 |
| Whitney |
|
99.3 | 532.83 | -0.17 | 562,229 | 560,875 | 564,808 | 23,064 |