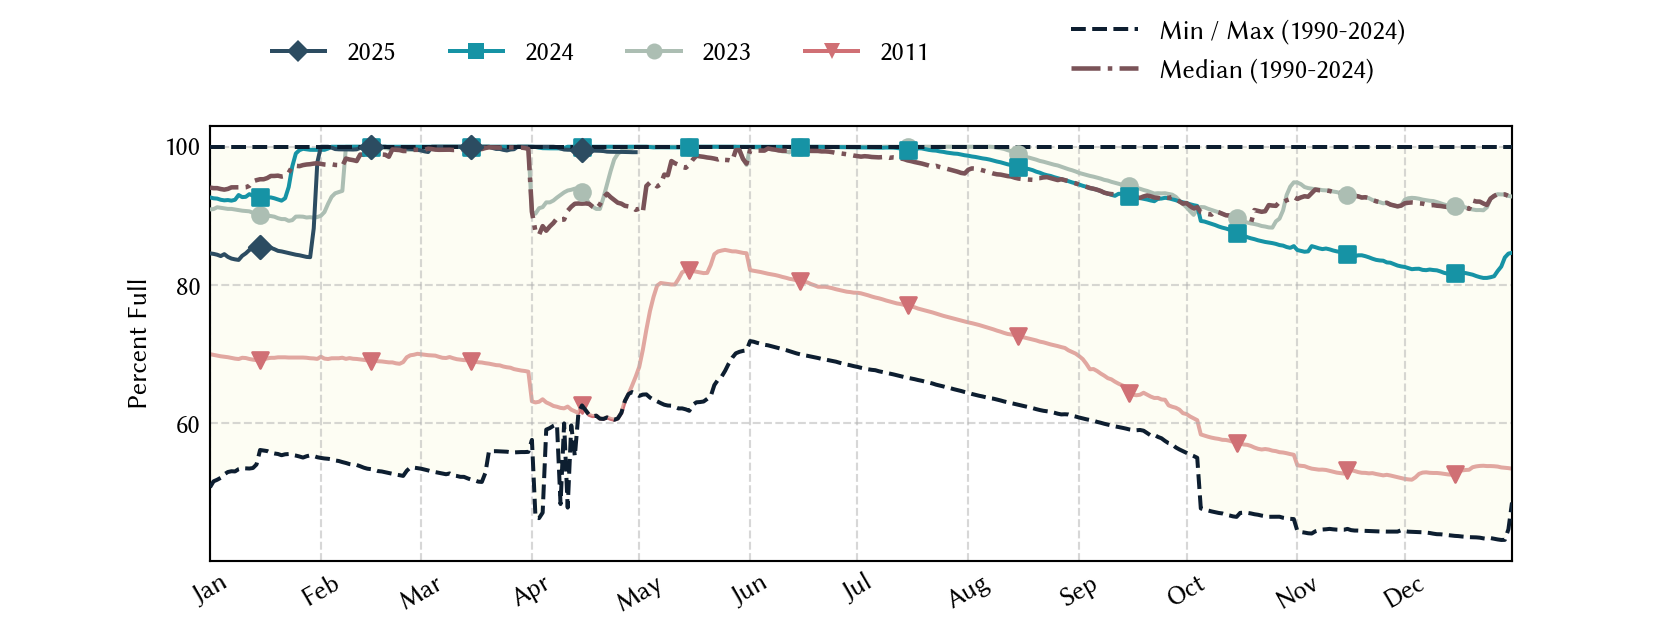
Sulphur River Basin Reservoirs: Monitored Water Supply Reservoirs are 90.0% full on 2026-07-31
Historical Data
| Date | Percent Full |
Reservoir Storage (acre-ft) |
Conservation Storage (acre-ft) |
Conservation Capacity (acre-ft) |
|
|---|---|---|---|---|---|
| Today | 2026-07-31 | 90.0 | 562,919 | 359,025 | 399,063 |
| Yesterday | 2026-07-30 | 90.1 | 563,947 | 359,395 | 399,063 |
| 2 days ago | 2026-07-29 | 90.2 | 565,986 | 360,117 | 399,063 |
| 1 week ago | 2026-07-24 | 91.0 | 574,731 | 363,039 | 399,063 |
| 1 month ago | 2026-06-30 | 93.0 | 751,531 | 371,278 | 399,063 |
| 3 months ago | 2026-04-30 | 87.2 | 457,486 | 348,157 | 399,063 |
| 6 months ago | 2026-01-31 | 79.2 | 423,818 | 316,083 | 399,063 |
| 1 year ago | 2025-07-31 | 98.1 | 582,736 | 391,502 | 399,063 |
*
Percent Full is based on Conservation Storage and Conservation Capacity and doesn't account for storage in flood pool.
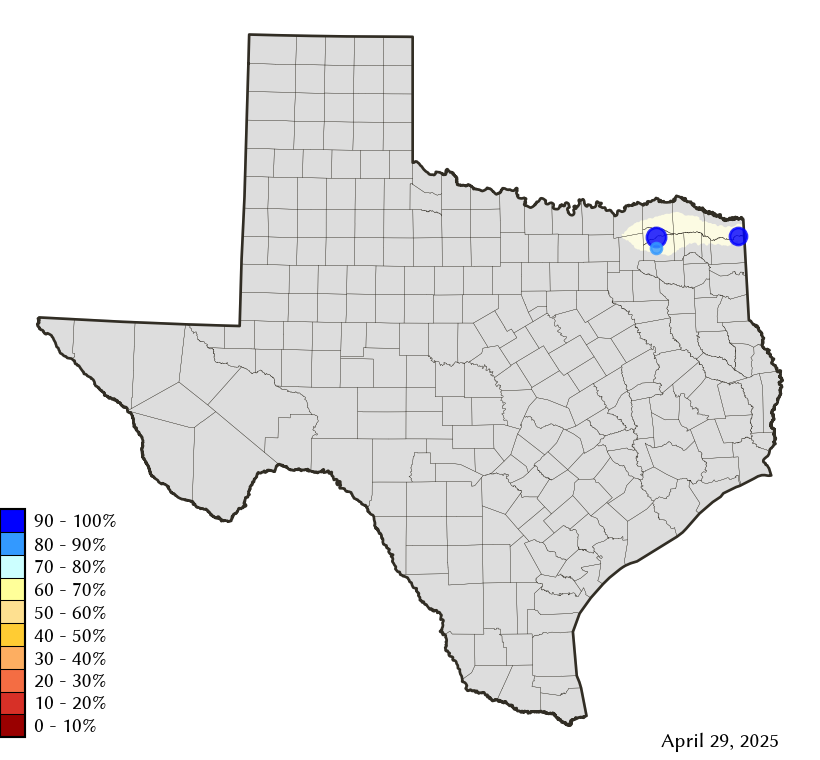
Area Map
Reservoir Storage
| Reservoir | Type | Percent Full |
Water Level (ft) |
Height Above Conservation Pool (ft) |
Reservoir Storage (acre-ft) |
Conservation Storage (acre-ft) |
Conservation Capacity (acre-ft) |
Surface Area (acres) |
|---|---|---|---|---|---|---|---|---|
| Jim Chapman |

|
84.6 | 437.70 | -2.30 | 254,624 | 218,849 | 258,723 | 16,675 |
| Sulphur Springs |

|
99.1 | 458.86 | -0.09 | 17,583 | 17,583 | 17,747 | - n.a. - |
| Wright Patman |
|
100.0 | 226.91 | 6.31 | 290,712 | 122,593 | 122,593 | - n.a. - |