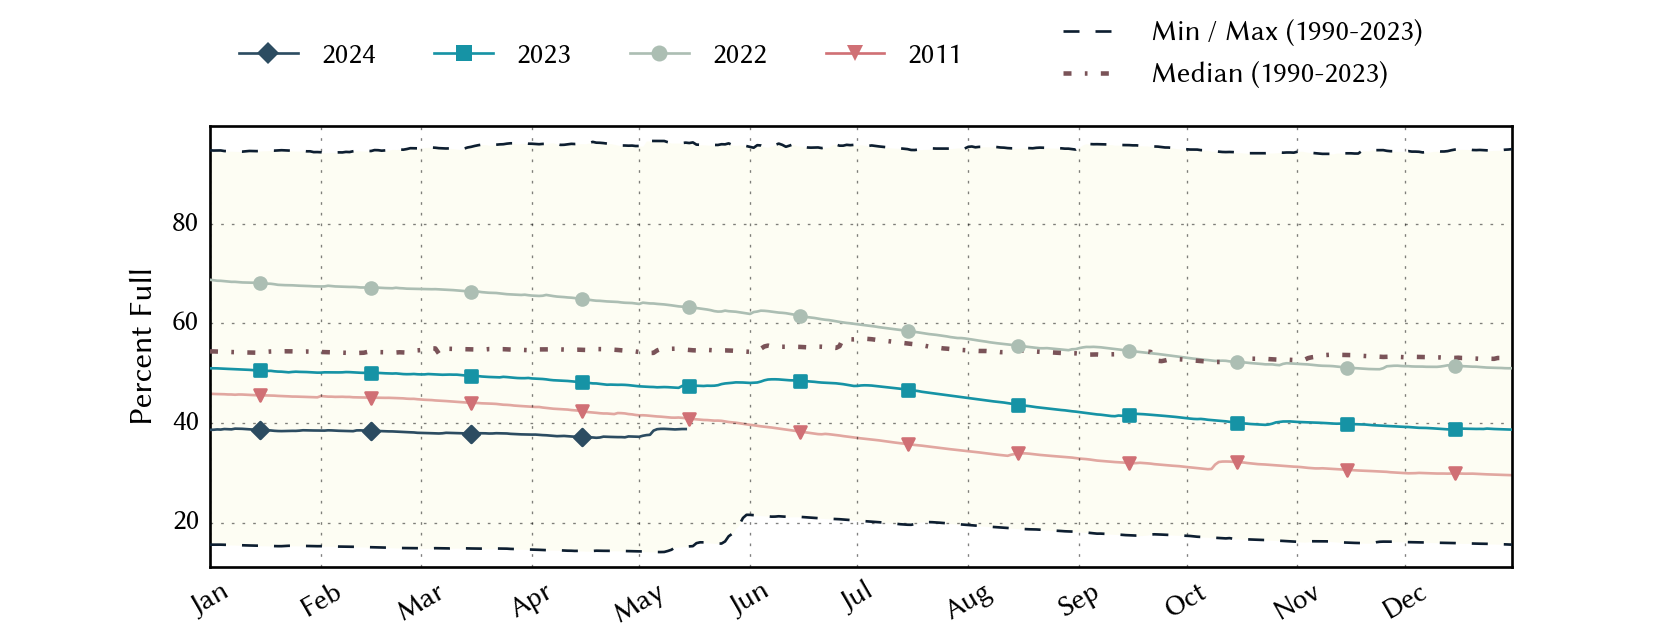
Abilene Area Reservoirs: Monitored Water Supply Reservoirs are 47.2% full on 2026-07-07
Historical Data
| Date | Percent Full |
Reservoir Storage (acre-ft) |
Conservation Storage (acre-ft) |
Conservation Capacity (acre-ft) |
|
|---|---|---|---|---|---|
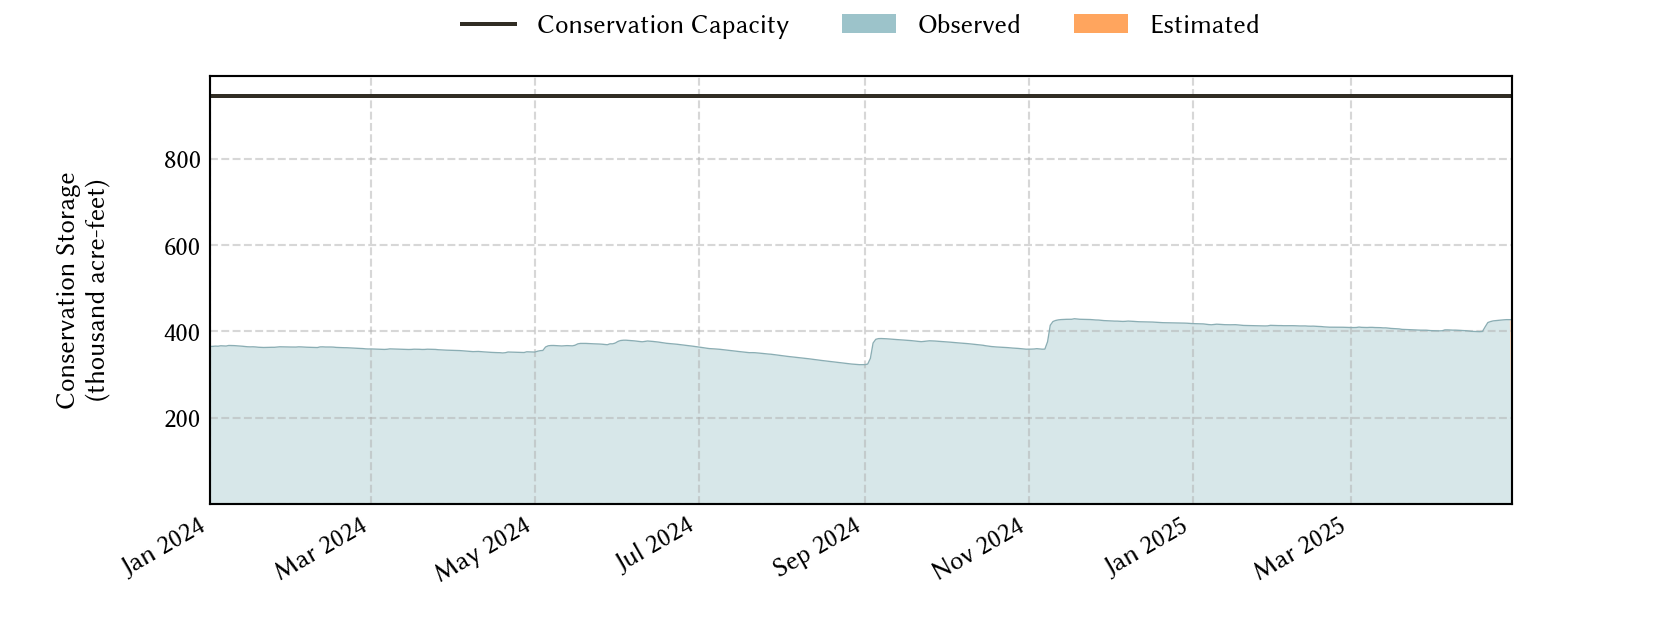
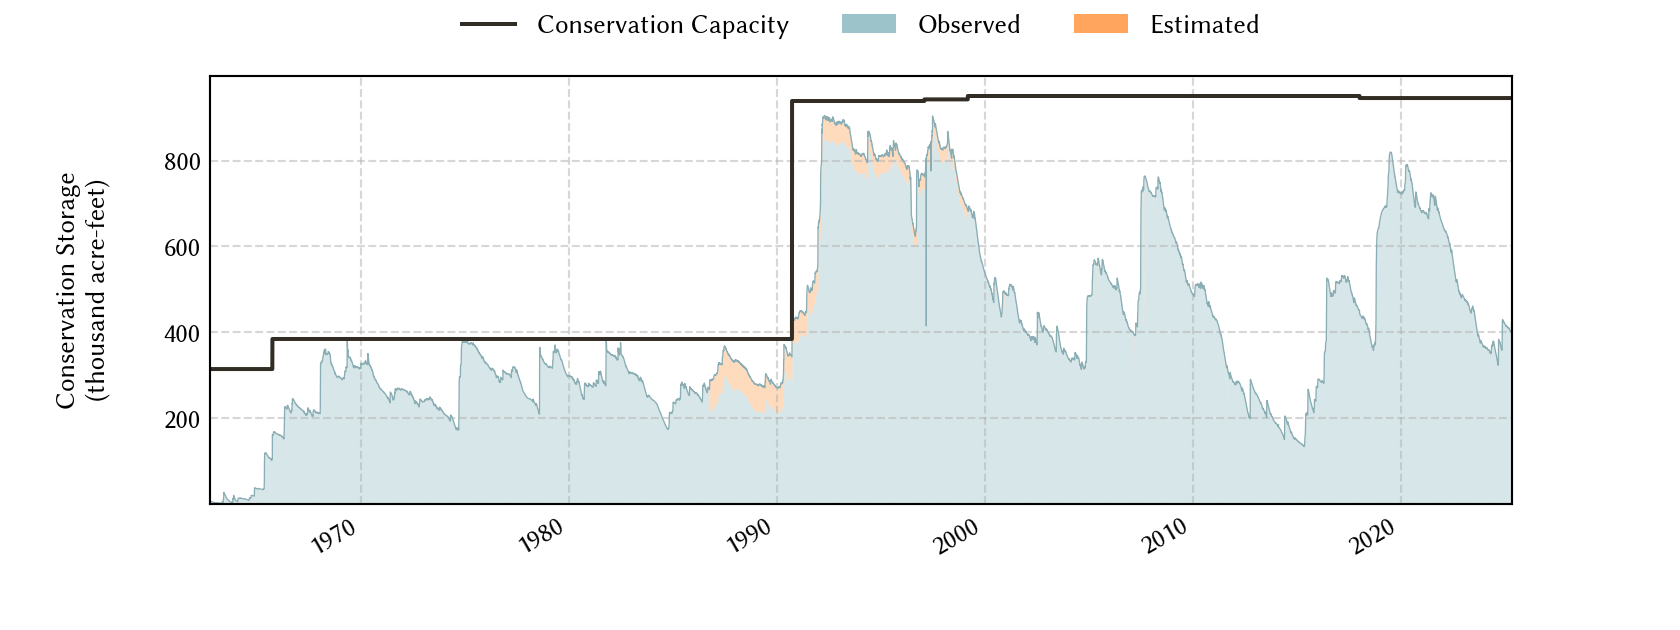
| Today | 2026-07-07 | 47.2 | 451,612 | 446,730 | 945,568 |
| Yesterday | 2026-07-06 | 47.3 | 451,895 | 447,013 | 945,568 |
| 2 days ago | 2026-07-05 | 47.2 | 451,420 | 446,538 | 945,568 |
| 1 week ago | 2026-06-30 | 47.7 | 455,895 | 451,013 | 945,568 |
| 1 month ago | 2026-06-07 | 49.1 | 469,379 | 464,497 | 945,568 |
| 3 months ago | 2026-04-07 | 45.5 | 435,128 | 430,246 | 945,568 |
| 6 months ago | 2026-01-07 | 47.5 | 454,111 | 449,229 | 945,568 |
| 1 year ago | 2025-07-07 | 56.2 | 536,510 | 531,628 | 945,568 |
*
Percent Full is based on Conservation Storage and Conservation Capacity and doesn't account for storage in flood pool.
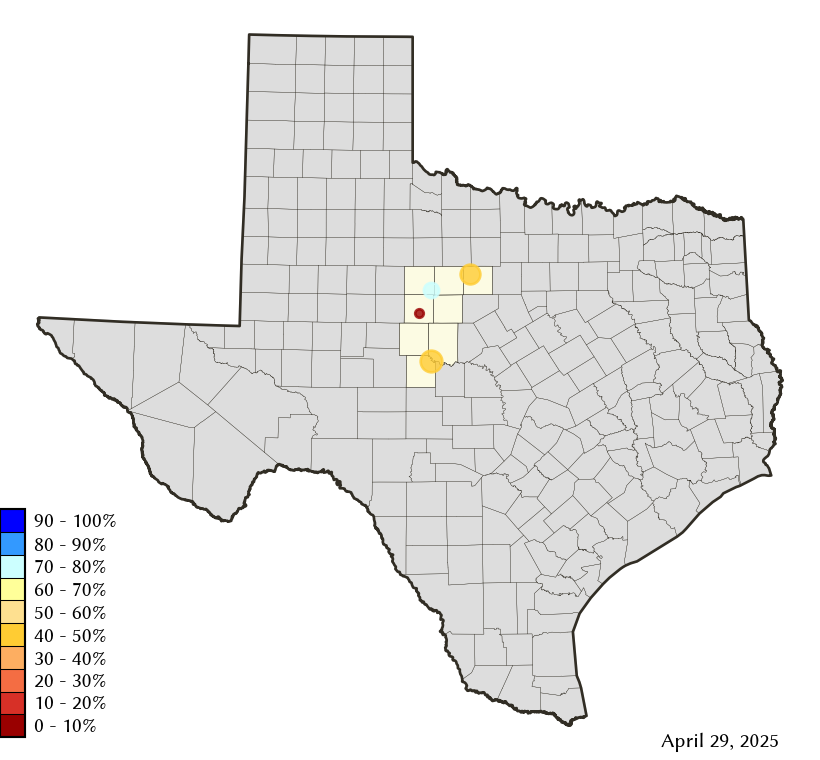
Area Map
Reservoir Storage
| Reservoir | Type | Percent Full |
Water Level (ft) |
Height Above Conservation Pool (ft) |
Reservoir Storage (acre-ft) |
Conservation Storage (acre-ft) |
Conservation Capacity (acre-ft) |
Surface Area (acres) |
|---|---|---|---|---|---|---|---|---|
| Abilene |

|
8.0 | 1,991.70 | -20.60 | 635 | 635 | 7,900 | 139 |
| Fort Phantom Hill |
|
77.2 | 1,631.44 | -4.46 | 54,098 | 54,092 | 70,030 | 3,233 |
| Hubbard Creek |
|
42.0 | 1,168.33 | -14.98 | 136,476 | 131,600 | 313,298 | 8,827 |
| O H Ivie |
|
47.0 | 1,532.14 | -19.36 | 260,403 | 260,403 | 554,340 | - n.a. - |