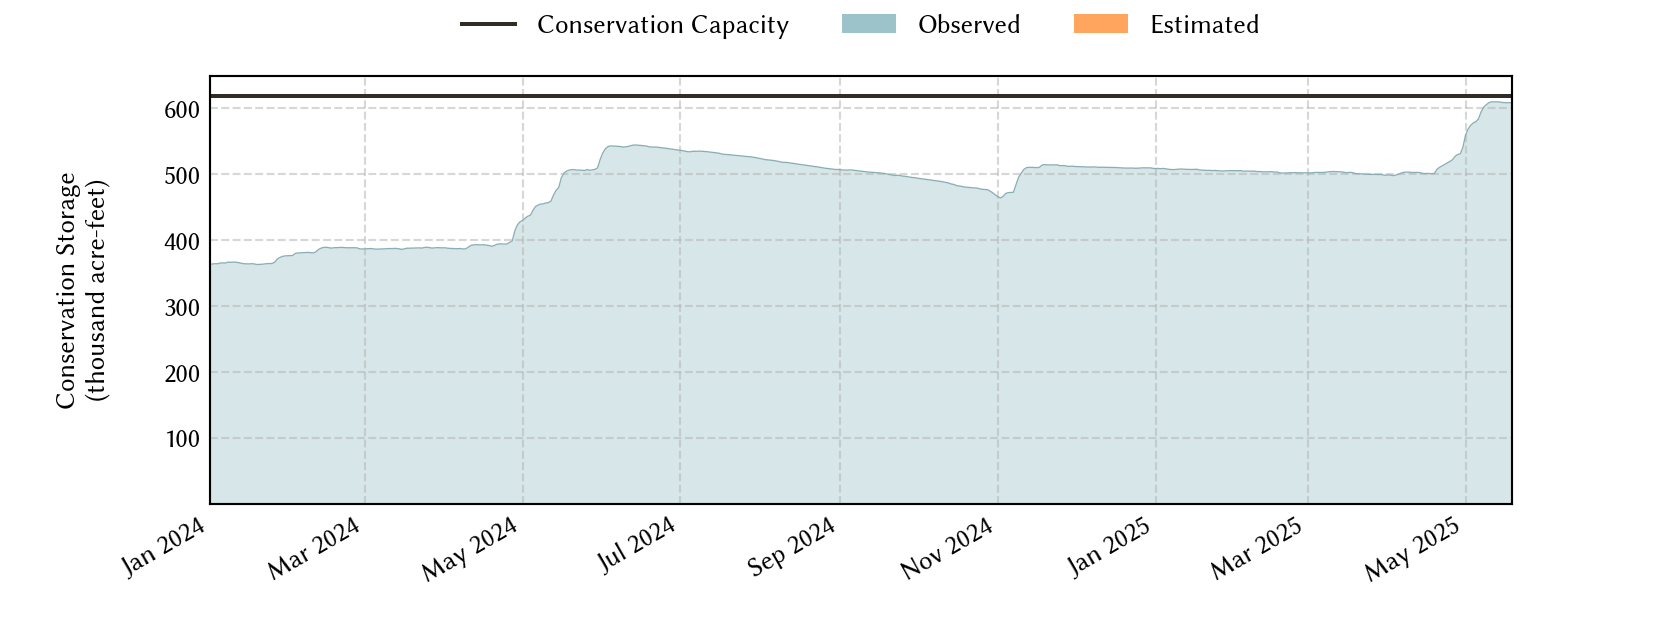
Region-B Planning Region Reservoirs: Monitored Water Supply Reservoirs are 82.0% full on 2026-07-28
Historical Data
| Date | Percent Full |
Reservoir Storage (acre-ft) |
Conservation Storage (acre-ft) |
Conservation Capacity (acre-ft) |
|
|---|---|---|---|---|---|
| Today | 2026-07-28 | 82.0 | 508,066 | 506,852 | 618,121 |
| Yesterday | 2026-07-27 | 82.1 | 508,945 | 507,731 | 618,121 |
| 2 days ago | 2026-07-26 | 82.3 | 509,972 | 508,758 | 618,121 |
| 1 week ago | 2026-07-21 | 83.0 | 514,508 | 513,294 | 618,121 |
| 1 month ago | 2026-06-28 | 90.3 | 559,086 | 557,872 | 618,121 |
| 3 months ago | 2026-04-28 | 90.0 | 557,742 | 556,528 | 618,121 |
| 6 months ago | 2026-01-28 | 89.0 | 551,519 | 550,305 | 618,121 |
| 1 year ago | 2025-07-28 | 97.8 | 643,072 | 604,792 | 618,121 |
*
Percent Full is based on Conservation Storage and Conservation Capacity and doesn't account for storage in flood pool.
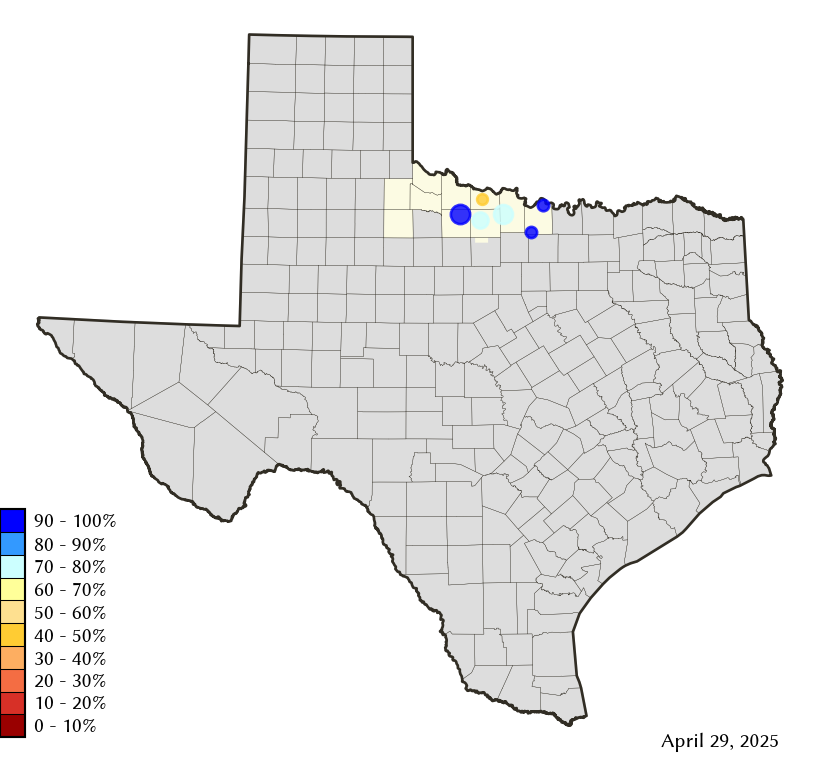
Area Map
Reservoir Storage
| Reservoir | Type | Percent Full |
Water Level (ft) |
Height Above Conservation Pool (ft) |
Reservoir Storage (acre-ft) |
Conservation Storage (acre-ft) |
Conservation Capacity (acre-ft) |
Surface Area (acres) |
|---|---|---|---|---|---|---|---|---|
| Amon G Carter |

|
84.7 | 917.90 | -2.10 | 17,106 | 16,322 | 19,266 | 1,332 |
| Arrowhead |
|
78.9 | 922.42 | -3.58 | 181,734 | 181,734 | 230,359 | 12,659 |
| Kemp |

|
83.0 | 1,141.73 | -2.27 | 203,851 | 203,725 | 245,307 | 11,467 |
| Kickapoo |
|
86.4 | 1,042.92 | -2.08 | 74,640 | 74,640 | 86,345 | 5,391 |
| Nocona |
|
80.2 | 824.18 | -3.32 | 17,497 | 17,193 | 21,444 | 1,218 |
| North Fork Buffalo Creek |
|
86.0 | 1,046.64 | -1.36 | 13,238 | 13,238 | 15,400 | 1,366 |