Coastal-Bend Planning Region Reservoirs: Monitored Water Supply Reservoirs are 28.3% full on 2026-07-31
Historical Data
| Date | Percent Full |
Reservoir Storage (acre-ft) |
Conservation Storage (acre-ft) |
Conservation Capacity (acre-ft) |
|
|---|---|---|---|---|---|
| Today | 2026-07-31 | 28.3 | 260,595 | 260,316 | 918,882 |
| Yesterday | 2026-07-30 | 27.5 | 252,746 | 252,467 | 918,882 |
| 2 days ago | 2026-07-29 | 27.0 | 248,533 | 248,254 | 918,882 |
| 1 week ago | 2026-07-24 | 21.2 | 194,933 | 194,654 | 918,882 |
| 1 month ago | 2026-06-30 | 15.9 | 146,398 | 146,119 | 918,882 |
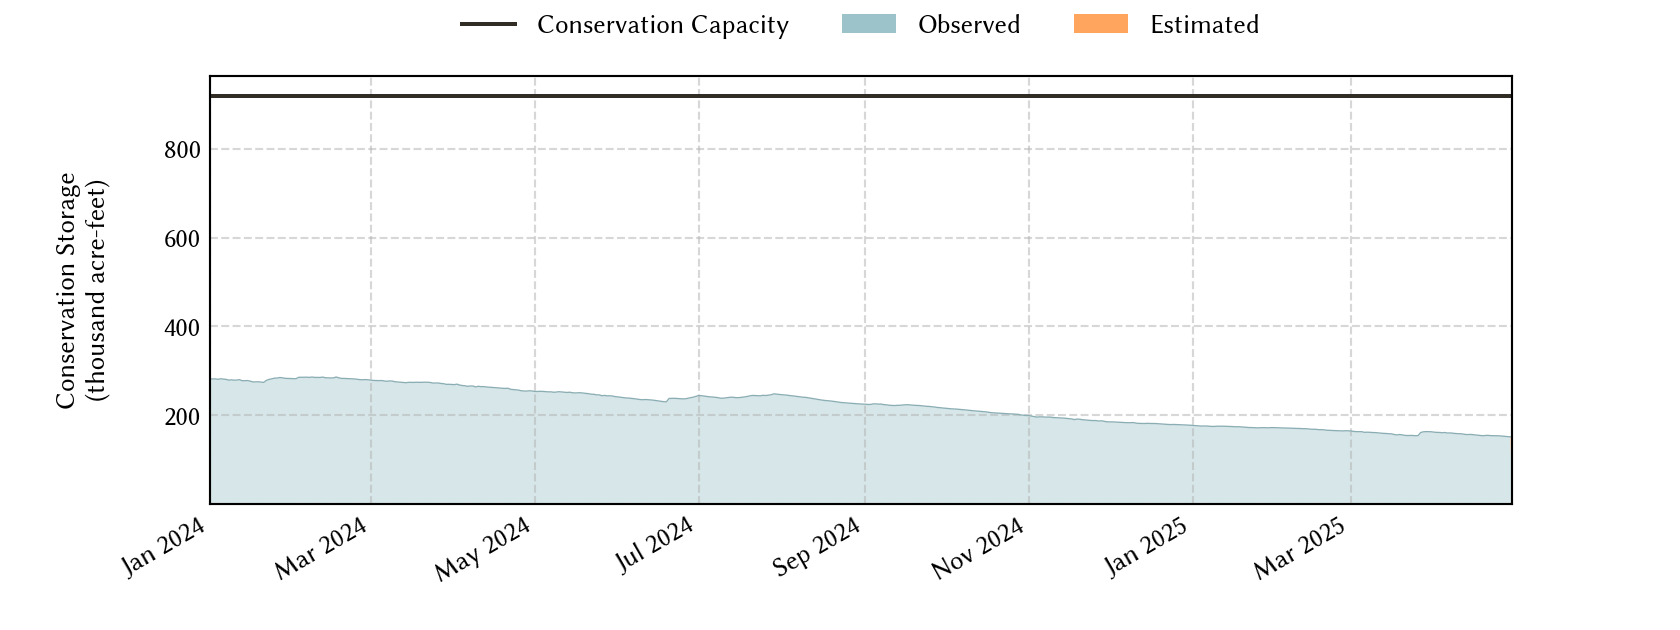
| 3 months ago | 2026-04-30 | 7.7 | 70,714 | 70,435 | 918,882 |
| 6 months ago | 2026-01-31 | 9.6 | 88,152 | 87,873 | 918,882 |
| 1 year ago | 2025-07-31 | 14.8 | 135,929 | 135,650 | 918,882 |
*
Percent Full is based on Conservation Storage and Conservation Capacity and doesn't account for storage in flood pool.
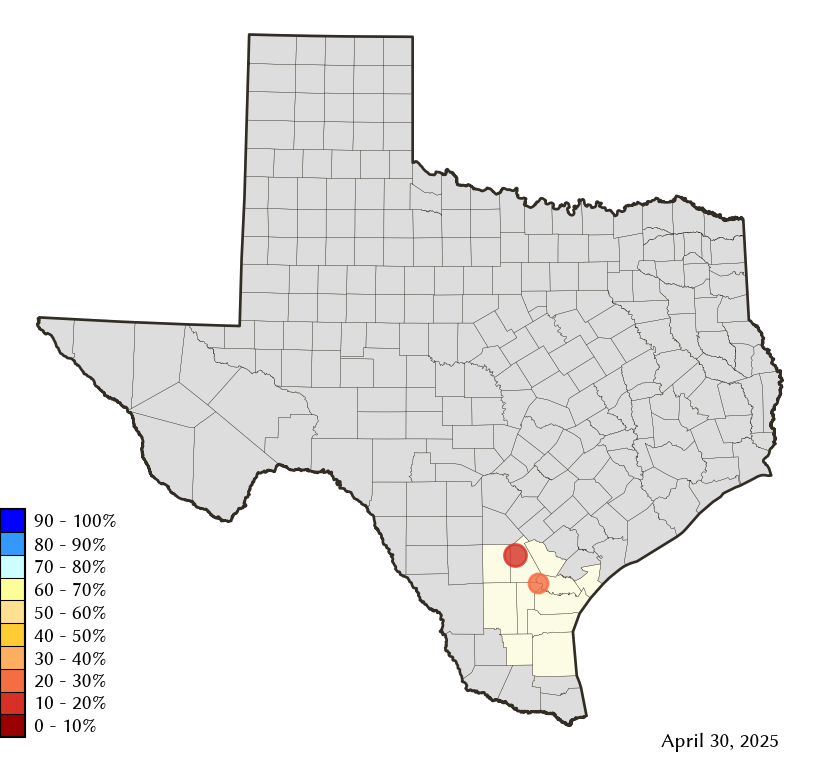
Area Map
Reservoir Storage
| Reservoir | Type | Percent Full |
Water Level (ft) |
Height Above Conservation Pool (ft) |
Reservoir Storage (acre-ft) |
Conservation Storage (acre-ft) |
Conservation Capacity (acre-ft) |
Surface Area (acres) |
|---|---|---|---|---|---|---|---|---|
| Choke Canyon |

|
25.0 | 192.90 | -27.60 | 165,414 | 165,413 | 662,820 | 11,102 |
| Corpus Christi |
|
37.1 | 84.03 | -9.97 | 95,181 | 94,903 | 256,062 | 11,893 |