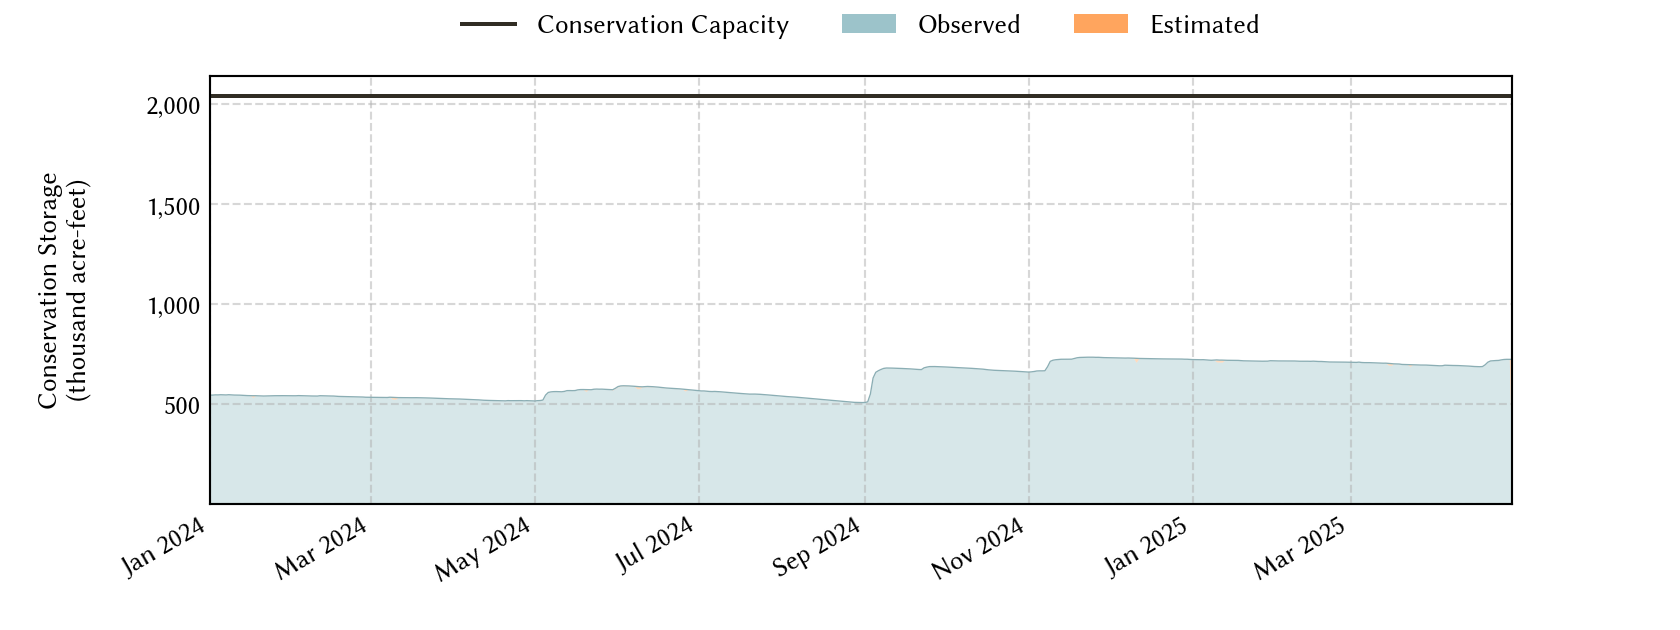
Region-F Planning Region Reservoirs: Monitored Water Supply Reservoirs are 34.3% full on 2026-07-23
Historical Data
| Date | Percent Full |
Reservoir Storage (acre-ft) |
Conservation Storage (acre-ft) |
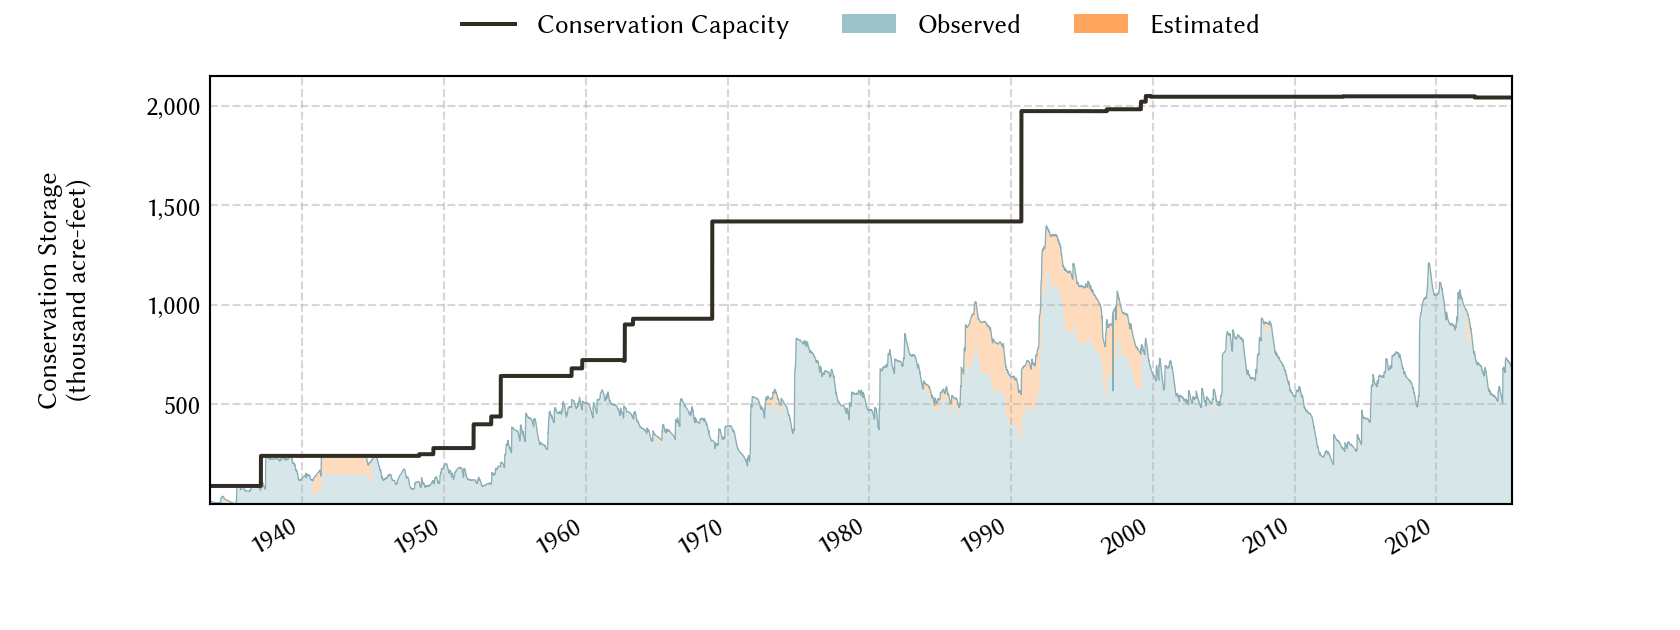
Conservation Capacity (acre-ft) |
|
|---|---|---|---|---|---|
| Today | 2026-07-23 | 34.3 | 707,765 | 701,056 | 2,041,927 |
| Yesterday | 2026-07-22 | 34.4 | 708,151 | 701,442 | 2,041,927 |
| 2 days ago | 2026-07-21 | 34.3 | 707,952 | 701,243 | 2,041,927 |
| 1 week ago | 2026-07-16 | 33.5 | 691,478 | 684,769 | 2,041,927 |
| 1 month ago | 2026-06-23 | 34.5 | 711,805 | 705,096 | 2,041,927 |
| 3 months ago | 2026-04-23 | 34.8 | 717,032 | 710,323 | 2,041,927 |
| 6 months ago | 2026-01-23 | 35.3 | 727,969 | 721,260 | 2,041,927 |
| 1 year ago | 2025-07-23 | 41.1 | 846,680 | 839,556 | 2,041,927 |
*
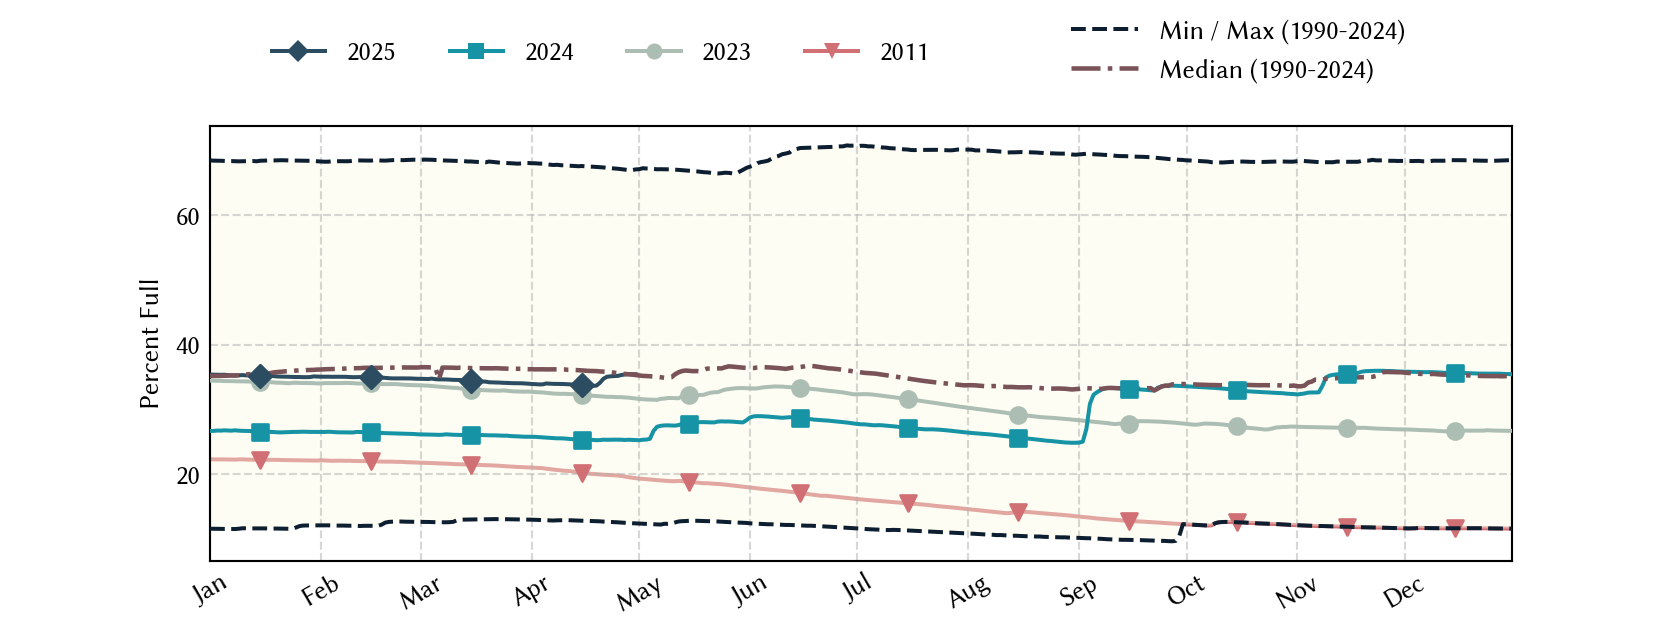
Percent Full is based on Conservation Storage and Conservation Capacity and doesn't account for storage in flood pool.
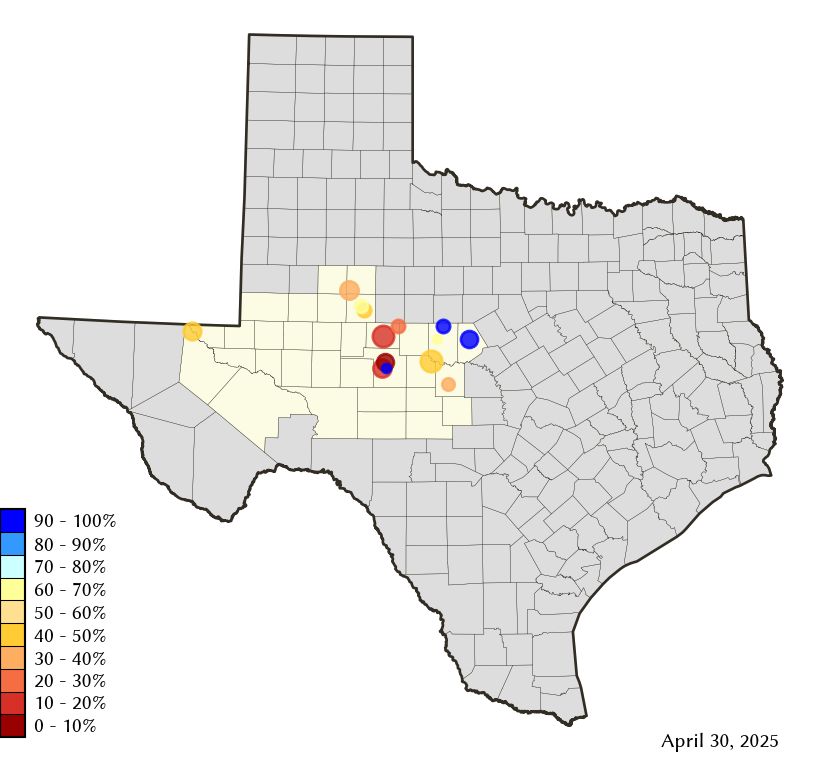
Area Map
Reservoir Storage
| Reservoir | Type | Percent Full |
Water Level (ft) |
Height Above Conservation Pool (ft) |
Reservoir Storage (acre-ft) |
Conservation Storage (acre-ft) |
Conservation Capacity (acre-ft) |
Surface Area (acres) |
|---|---|---|---|---|---|---|---|---|
| Brady Creek |

|
93.4 | 1,742.00 | -1.00 | 28,516 | 26,894 | 28,808 | 1,941 |
| Brownwood |
|
92.8 | 1,423.49 | -1.11 | 121,475 | 121,475 | 130,868 | 6,503 |
| Champion Creek |
|
45.4 | 2,063.93 | -19.07 | 18,894 | 18,894 | 41,580 | 894 |
| Coleman |
|
85.4 | 1,714.35 | -3.15 | 32,547 | 32,529 | 38,075 | 1,703 |
| Colorado City |
|
58.4 | 2,060.28 | -9.92 | 17,972 | 17,972 | 30,758 | - n.a. - |
| E V Spence |
|
10.9 | 1,844.50 | -53.50 | 56,357 | 56,357 | 517,272 | 3,585 |
| Hords Creek |

|
51.7 | 1,890.13 | -9.87 | 4,196 | 4,193 | 8,109 | 299 |
| J B Thomas |
|
24.3 | 2,228.75 | -29.25 | 49,305 | 48,632 | 199,931 | 3,350 |
| Nasworthy |
|
86.1 | 1,871.77 | -0.94 | 8,775 | 8,282 | 9,615 | 1,237 |
| O C Fisher |
|
12.8 | 1,874.22 | -33.78 | 14,836 | 14,835 | 115,742 | 1,245 |
| O H Ivie |
|
46.8 | 1,532.05 | -19.45 | 259,365 | 259,365 | 554,340 | - n.a. - |
| Oak Creek |
|
16.7 | 1,975.50 | -24.50 | 6,703 | 6,553 | 39,210 | 598 |
| Red Bluff |
|
48.5 | 2,815.62 | -12.48 | 70,393 | 70,393 | 145,165 | 4,704 |
| Twin Buttes |
|
8.0 | 1,900.07 | -40.13 | 18,431 | 14,682 | 182,454 | 1,360 |