Reservoir Storage Summary for Climate Divisions on 2026-07-07
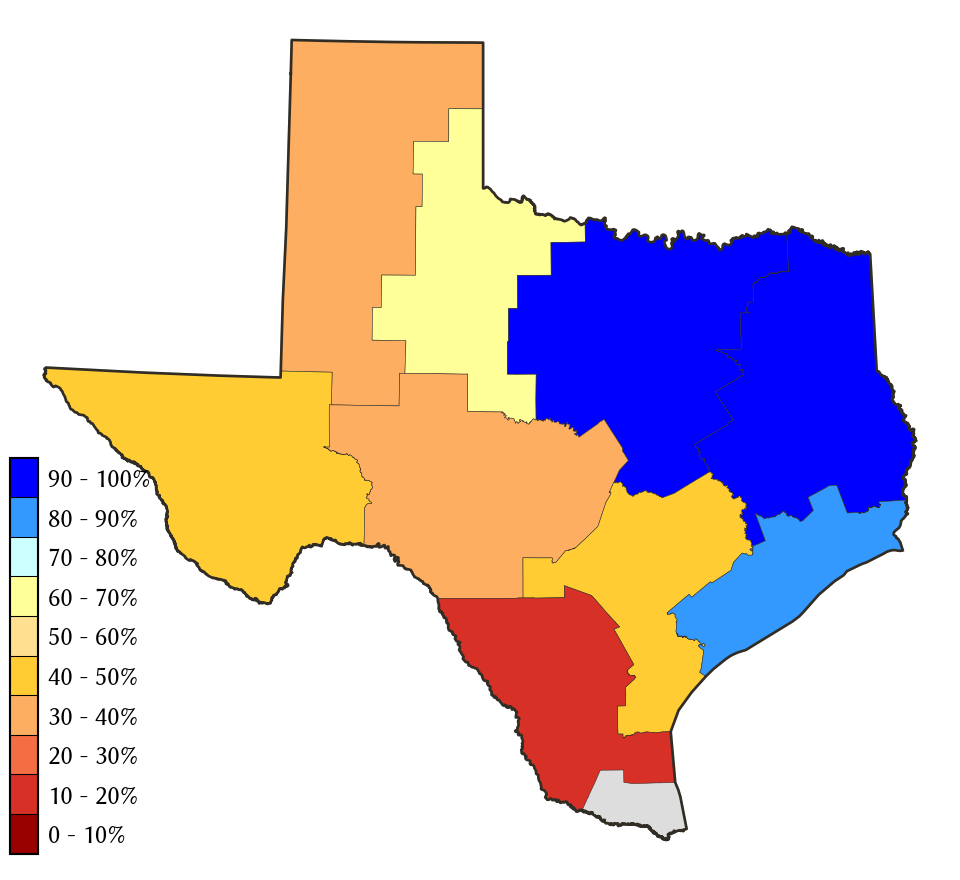
Percent Full
| Today | Yesterday | 2 days ago | 1 week ago | 1 month ago | 3 months ago | 6 months ago | 1 year ago | |
|---|---|---|---|---|---|---|---|---|
| 2026-07-07 | 2026-07-06 | 2026-07-05 | 2026-06-30 | 2026-06-07 | 2026-04-07 | 2026-01-07 | 2025-07-07 | |
| East Texas | 88.7 | 88.7 | 88.8 | 89.1 | 88.0 | 86.7 | 84.2 | 97.8 |
| Edwards Plateau | 45.1 | 45.1 | 45.1 | 45.2 | 45.4 | 44.4 | 47.1 | 43.2 |
| High Plains | 36.6 | 36.6 | 36.6 | 36.8 | 37.1 | 38.0 | 39.2 | 38.7 |
| Low Rolling Plains | 60.2 | 60.4 | 60.2 | 61.2 | 63.1 | 62.6 | 65.1 | 72.8 |
| North Central | 95.2 | 95.2 | 95.2 | 95.5 | 94.8 | 92.9 | 91.2 | 98.3 |
| South | 21.4 | 21.5 | 21.6 | 21.9 | 19.7 | 14.8 | 15.0 | 15.4 |
| South Central | 71.5 | 71.6 | 71.6 | 72.0 | 69.1 | 61.7 | 65.7 | 60.1 |
| Trans Pecos | 49.5 | 49.6 | 49.6 | 49.7 | 51.4 | 57.0 | 53.2 | 50.5 |
| Upper Coast | 98.8 | 99.0 | 99.0 | 99.6 | 99.6 | 72.8 | 79.8 | 99.6 |
*
Percent Full is based on Conservation Storage and Conservation Capacity.
Recent Conditions
| Percent Full |
Reservoir Storage (acre-ft) |
Conservation Storage (acre-ft) |
Conservation Capacity (acre-ft) |
|
|---|---|---|---|---|
| East Texas | 88.7 | 11,374,384 | 8,790,987 | 9,915,173 |
| Edwards Plateau | 45.1 | 2,034,748 | 1,922,954 | 4,261,647 |
| High Plains | 36.6 | 272,310 | 233,896 | 639,362 |
| Low Rolling Plains | 60.2 | 546,696 | 544,152 | 903,870 |
| North Central | 95.2 | 12,052,553 | 10,452,362 | 10,983,823 |
| South | 21.4 | 653,457 | 532,107 | 2,481,249 |
| South Central | 71.5 | 1,416,275 | 1,385,645 | 1,936,953 |
| Trans Pecos | 49.5 | 71,890 | 71,890 | 145,165 |
| Upper Coast | 98.8 | 297,744 | 287,927 | 291,293 |
**
The Lower Valley climate division has no contributing Reservoirs present.