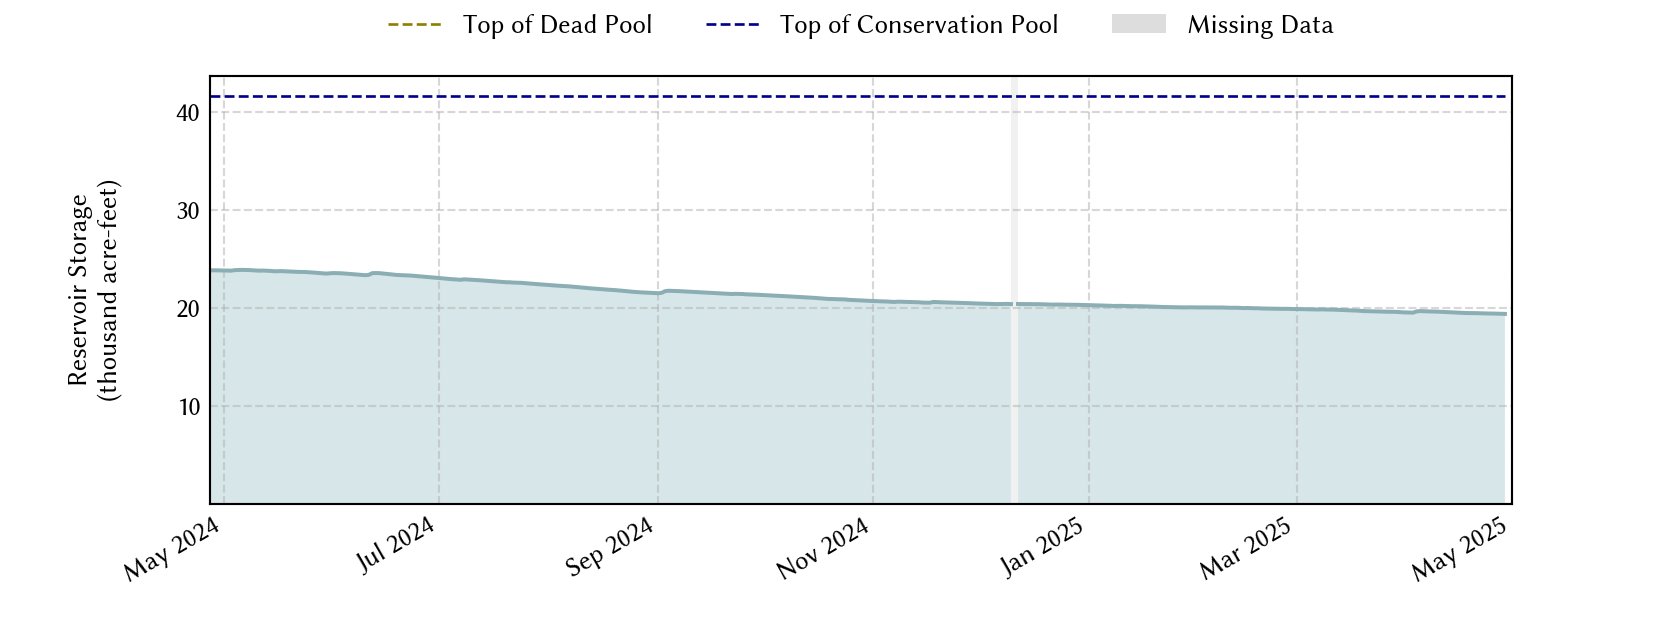
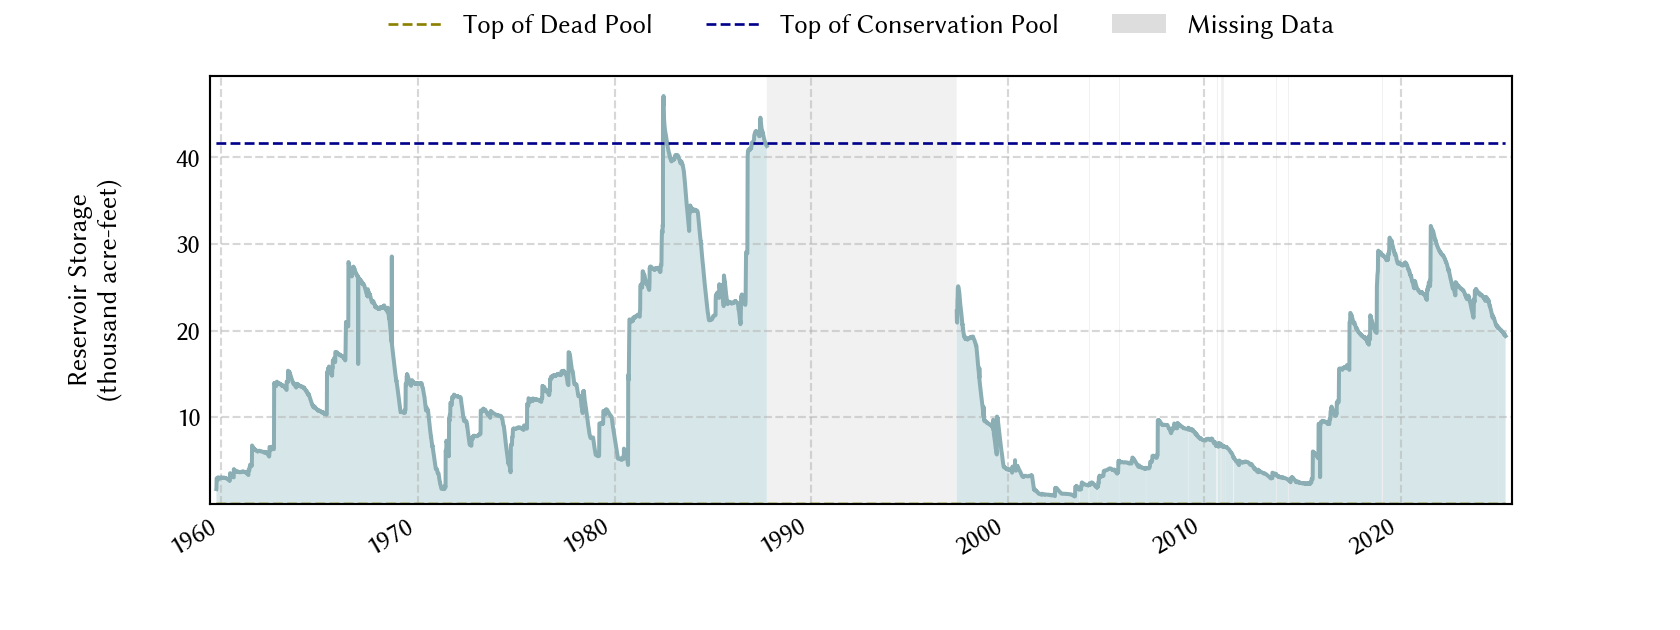
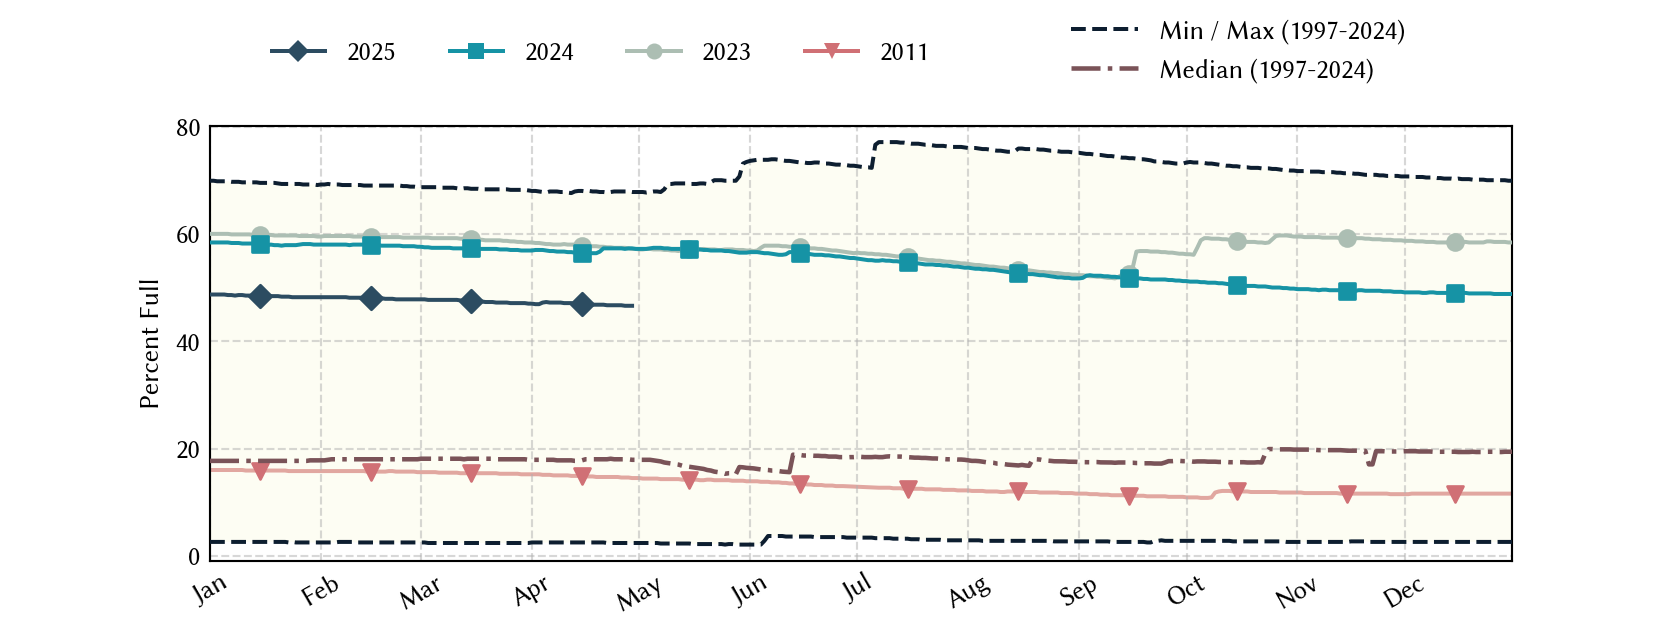
Champion Creek Reservoir: 45.0% full as of 2026-07-30
Historical Data
| Date | Percent Full |
Mean Water Level (ft) |
Reservoir Storage (acre-ft) |
Conservation Storage (acre-ft) |
Conservation Capacity (acre-ft) |
Surface Area (acres) |
|
|---|---|---|---|---|---|---|---|
| Today | 2026-07-30 | 45.0 | 2,063.74 | 18,728 | 18,728 | 41,580 | 889 |
| Yesterday | 2026-07-29 | 45.1 | 2,063.76 | 18,745 | 18,745 | 41,580 | 890 |
| 2 days ago | 2026-07-28 | 45.1 | 2,063.79 | 18,772 | 18,772 | 41,580 | 891 |
| 1 week ago | 2026-07-23 | 45.4 | 2,063.93 | 18,894 | 18,894 | 41,580 | 894 |
| 1 month ago | 2026-06-30 | 38.5 | 2,060.72 | 16,012 | 16,012 | 41,580 | 815 |
| 3 months ago | 2026-04-30 | 39.4 | 2,061.14 | 16,370 | 16,370 | 41,580 | 826 |
| 6 months ago | 2026-01-30 | - n.a. - | - n.a. - | - n.a. - | - n.a. - | - n.a. - | - n.a. - |
| 1 year ago | 2025-07-30 | 46.1 | 2,064.23 | 19,173 | 19,173 | 41,580 | 903 |
*
Percent Full is based on Conservation Storage and Conservation Capacity and doesn't account for storage in flood pool.
**
Values above, including today's are averaged conditions. For near real-time instantaneous water level, see table below or the interactive map viewer.
Most Recent Instantaneous Water Level
| Date/time |
Water Level (ft) |
Conservation Pool Elevation (ft) |
Height Above Conservation Pool (ft) |
|
|---|---|---|---|---|
| Most recent | 2026-07-30 15:15 | 2,063.74 | 2,083.00 | -19.26 |
| 1 hour prior | 2026-07-30 14:15 | 2,063.75 | 2,083.00 | -19.25 |
| 2 hours prior | 2026-07-30 13:15 | 2,063.75 | 2,083.00 | -19.25 |
| 6 hours prior | 2026-07-30 09:15 | 2,063.74 | 2,083.00 | -19.26 |
| 12 hours prior | 2026-07-30 03:15 | 2,063.74 | 2,083.00 | -19.26 |
| 24 hours prior | 2026-07-29 15:15 | 2,063.77 | 2,083.00 | -19.23 |
| 48 hours prior | 2026-07-28 15:15 | 2,063.80 | 2,083.00 | -19.20 |
*
Data is provisional and subject to revision.
Additional Information
| Impoundment date | 1959-01-01 |
| Vertical datum | NGVD29 |
| Dead pool elevation | 2,020.00 ft above NGVD29 |
| Service spillway crest elevation | 2,083.00 ft above NGVD29 |
| Emergency spillway crest elevation | 2,091.00 ft above NGVD29 |
| Maximum design elevation | 2,104.10 ft above NGVD29 |
| Top of dam elevation | 2,109.00 ft above NGVD29 |
| Conservation pool elevation | 2,083.00 ft above NGVD29 |
| Data download (CSV) | period of record, last one year, last 30 days |
Elevation-Area-Capacity Curves
1974-10-01 (source: TWDB)
|
|
| Data Source | USGS:08123600 |
| USGS Monitoring Location | USGS:08123600 |
Lake Location