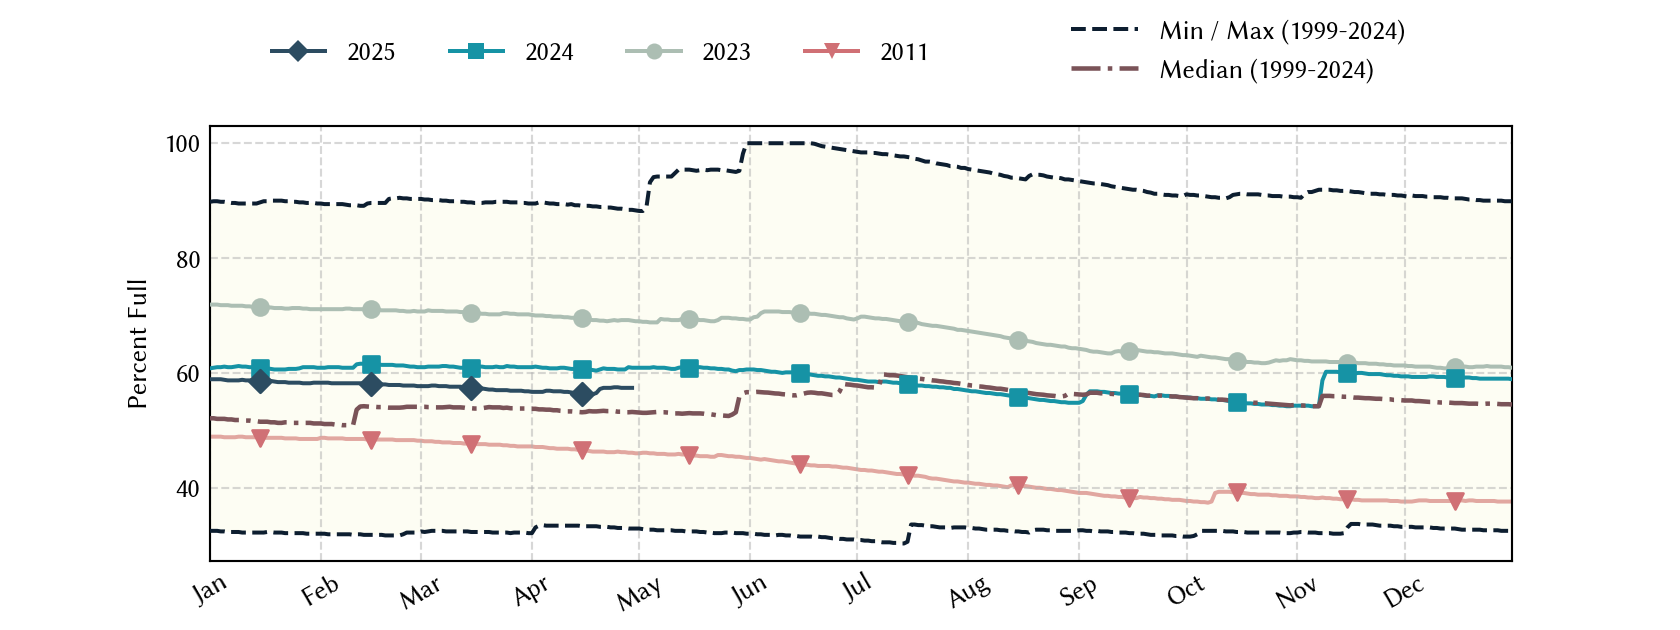
Lake Cisco: 45.0% full as of 2026-08-02
Historical Data
| Date | Percent Full |
Mean Water Level (ft) |
Reservoir Storage (acre-ft) |
Conservation Storage (acre-ft) |
Conservation Capacity (acre-ft) |
Surface Area (acres) |
|
|---|---|---|---|---|---|---|---|
| Today | 2026-08-02 | 45.0 | 1,504.28 | 13,061 | 13,061 | 29,003 | 608 |
| Yesterday | 2026-08-01 | 45.1 | 1,504.31 | 13,079 | 13,079 | 29,003 | 608 |
| 2 days ago | 2026-07-31 | 45.2 | 1,504.35 | 13,102 | 13,102 | 29,003 | 609 |
| 1 week ago | 2026-07-26 | 45.5 | 1,504.51 | 13,197 | 13,197 | 29,003 | 613 |
| 1 month ago | 2026-07-02 | 45.9 | 1,504.71 | 13,317 | 13,317 | 29,003 | 617 |
| 3 months ago | 2026-05-02 | 47.6 | 1,505.55 | 13,818 | 13,818 | 29,003 | 636 |
| 6 months ago | 2026-02-02 | 48.1 | 1,505.75 | 13,944 | 13,944 | 29,003 | 641 |
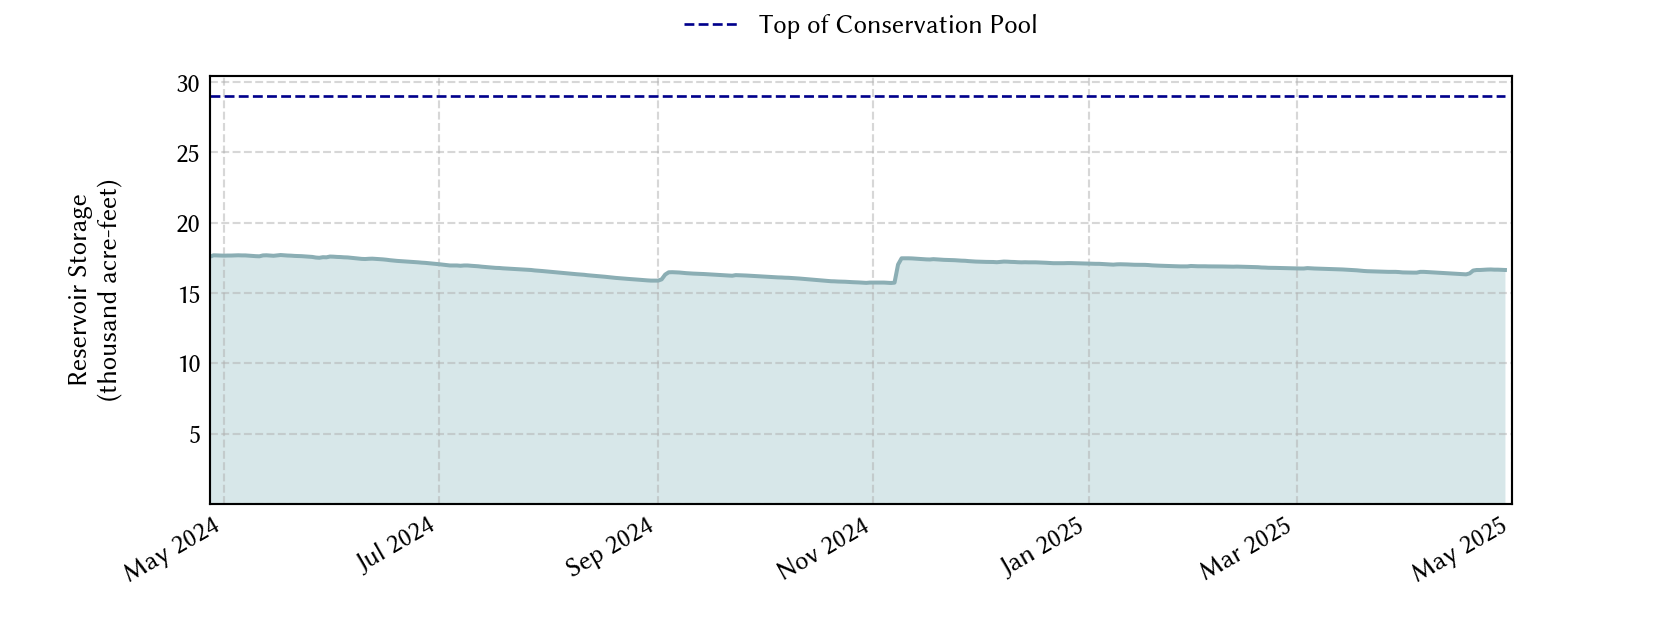
| 1 year ago | 2025-08-02 | 54.5 | 1,508.39 | 15,800 | 15,800 | 29,003 | 701 |
*
Percent Full is based on Conservation Storage and Conservation Capacity and doesn't account for storage in flood pool.
**
Values above, including today's are averaged conditions. For near real-time instantaneous water level, see table below or the interactive map viewer.
Most Recent Instantaneous Water Level
| Date/time |
Water Level (ft) |
Conservation Pool Elevation (ft) |
Height Above Conservation Pool (ft) |
|
|---|---|---|---|---|
| Most recent | 2026-08-02 15:30 | 1,504.29 | 1,522.46 | -18.17 |
| 1 hour prior | 2026-08-02 14:30 | 1,504.29 | 1,522.46 | -18.17 |
| 2 hours prior | 2026-08-02 13:30 | 1,504.28 | 1,522.46 | -18.18 |
| 6 hours prior | 2026-08-02 09:30 | 1,504.29 | 1,522.46 | -18.17 |
| 12 hours prior | 2026-08-02 03:30 | 1,504.28 | 1,522.46 | -18.18 |
| 24 hours prior | 2026-08-01 15:30 | 1,504.32 | 1,522.46 | -18.14 |
| 48 hours prior | 2026-07-31 15:30 | 1,504.35 | 1,522.46 | -18.11 |
*
Data is provisional and subject to revision.
Additional Information
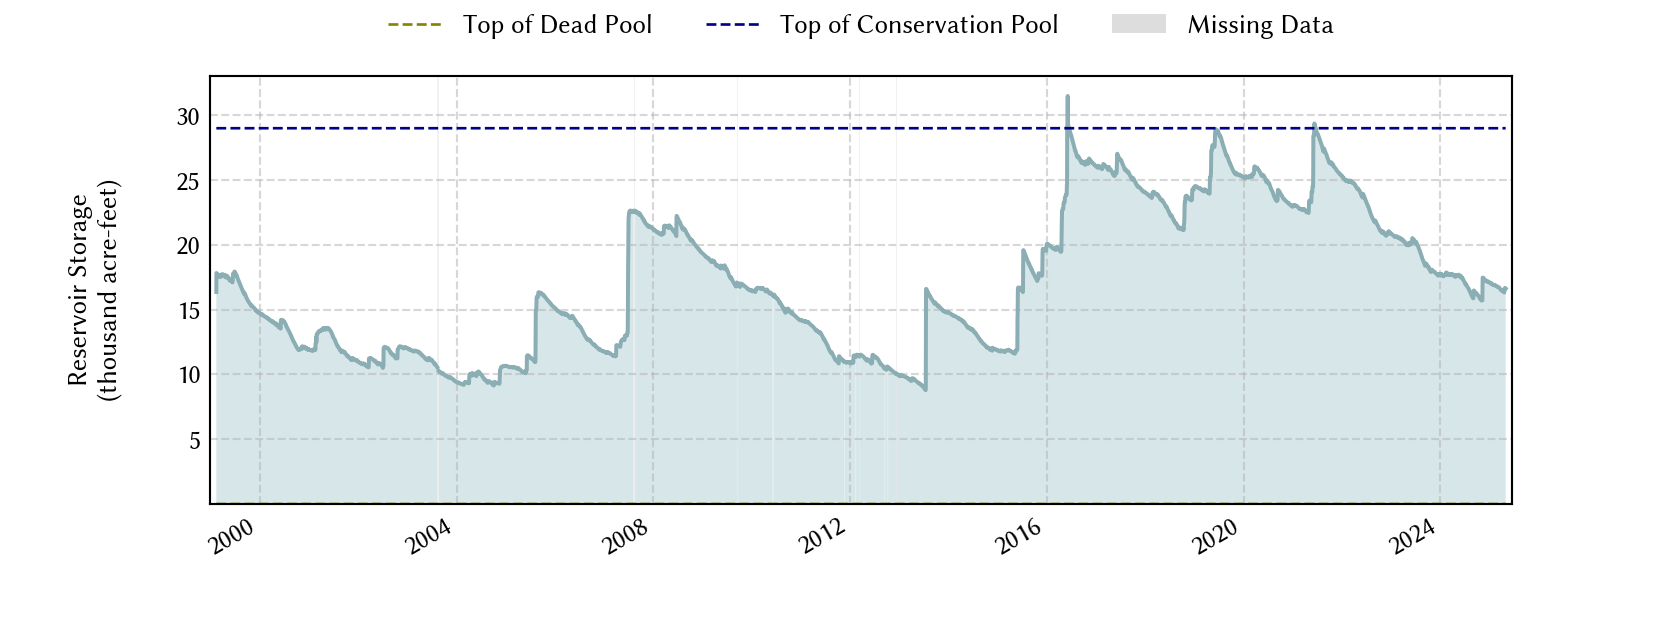
| Impoundment date | 1923-01-01 |
| Vertical datum | NGVD29 |
| Service spillway crest elevation | 1,522.46 ft above NGVD29 |
| Top of dam elevation | 1,528.50 ft above NGVD29 |
|
Conservation pool elevation |
1,522.46 ft above NGVD29 |
|
Conservation pool elevation |
1,496.00 ft above NGVD29 |
| Data download (CSV) | period of record, last one year, last 30 days |
Elevation-Area-Capacity Curves
1974-10-01 (source: TWDB)
|
|
| Data Source | USGS:08086215 |
| USGS Monitoring Location | USGS:08086215 |
Lake Location