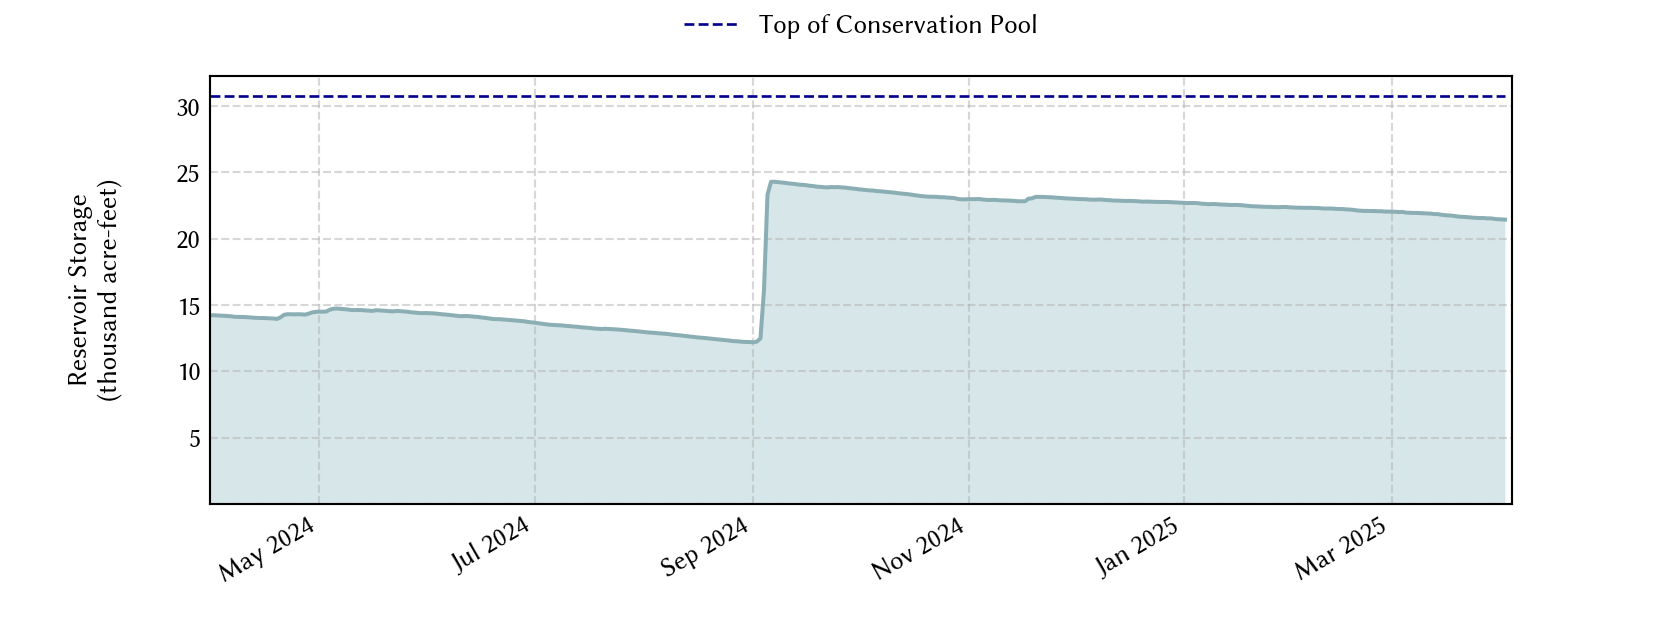
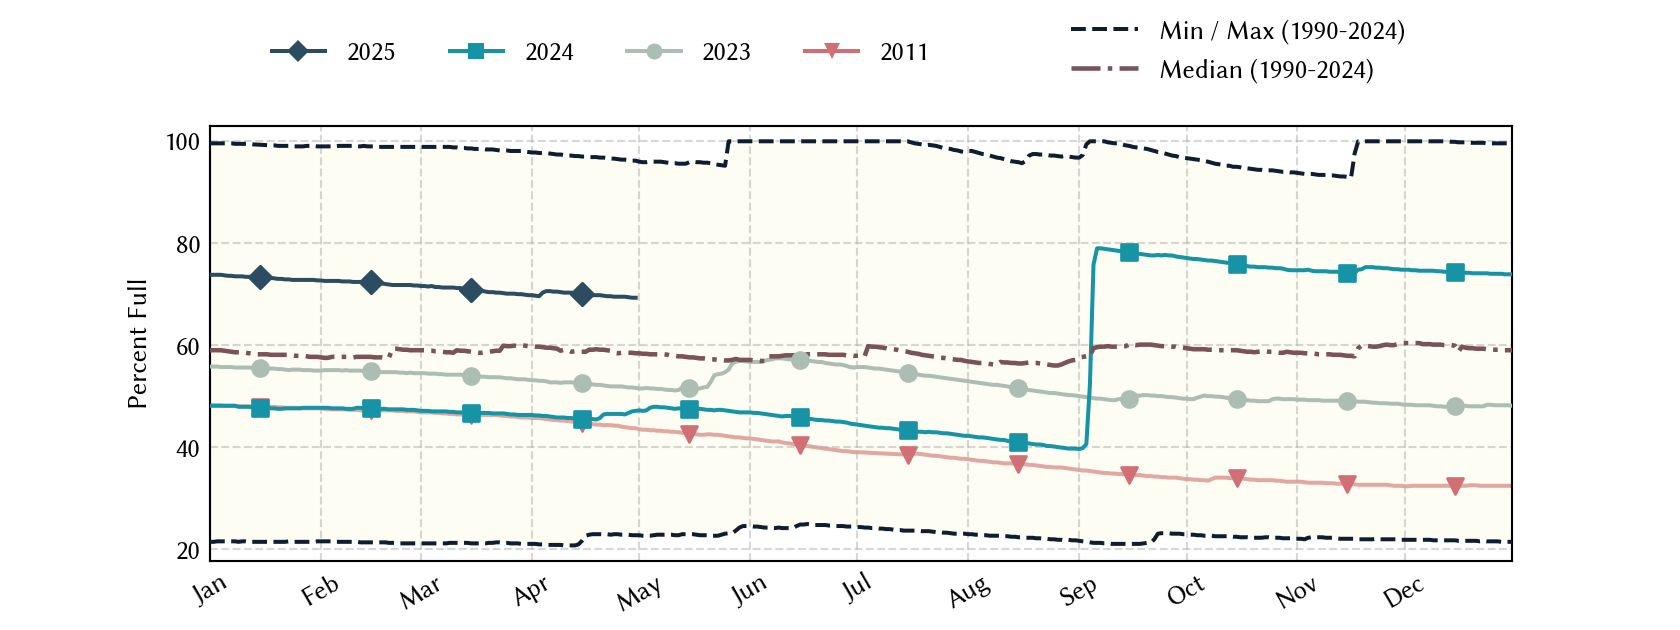
Lake Colorado City: 57.5% full as of 2026-08-02
Historical Data
| Date | Percent Full |
Mean Water Level (ft) |
Reservoir Storage (acre-ft) |
Conservation Storage (acre-ft) |
Conservation Capacity (acre-ft) |
Surface Area (acres) |
|
|---|---|---|---|---|---|---|---|
| Today | 2026-08-02 | 57.5 | 2,060.04 | 17,699 | 17,699 | 30,758 | - n.a. - |
| Yesterday | 2026-08-01 | 57.6 | 2,060.06 | 17,721 | 17,721 | 30,758 | - n.a. - |
| 2 days ago | 2026-07-31 | 57.7 | 2,060.09 | 17,756 | 17,756 | 30,758 | - n.a. - |
| 1 week ago | 2026-07-26 | 58.2 | 2,060.22 | 17,904 | 17,904 | 30,758 | - n.a. - |
| 1 month ago | 2026-07-02 | 49.5 | 2,057.75 | 15,238 | 15,238 | 30,758 | - n.a. - |
| 3 months ago | 2026-05-02 | 52.3 | 2,058.57 | 16,097 | 16,097 | 30,758 | - n.a. - |
| 6 months ago | 2026-02-02 | 55.2 | 2,059.39 | 16,982 | 16,982 | 30,758 | - n.a. - |
| 1 year ago | 2025-08-02 | 63.5 | 2,061.61 | 19,519 | 19,519 | 30,758 | - n.a. - |
*
Percent Full is based on Conservation Storage and Conservation Capacity and doesn't account for storage in flood pool.
**
Values above, including today's are averaged conditions. For near real-time instantaneous water level, see table below or the interactive map viewer.
Most Recent Instantaneous Water Level
| Date/time |
Water Level (ft) |
Conservation Pool Elevation (ft) |
Height Above Conservation Pool (ft) |
|
|---|---|---|---|---|
| Most recent | 2026-08-02 15:00 | 2,060.01 | 2,070.20 | -10.19 |
| 1 hour prior | 2026-08-02 14:00 | 2,060.03 | 2,070.20 | -10.17 |
| 2 hours prior | 2026-08-02 13:00 | 2,060.04 | 2,070.20 | -10.16 |
| 6 hours prior | 2026-08-02 09:00 | 2,060.04 | 2,070.20 | -10.16 |
| 12 hours prior | 2026-08-02 03:00 | 2,060.04 | 2,070.20 | -10.16 |
| 24 hours prior | 2026-08-01 15:00 | 2,060.06 | 2,070.20 | -10.14 |
| 48 hours prior | 2026-07-31 15:00 | 2,060.09 | 2,070.20 | -10.11 |
*
Data is provisional and subject to revision.
Additional Information
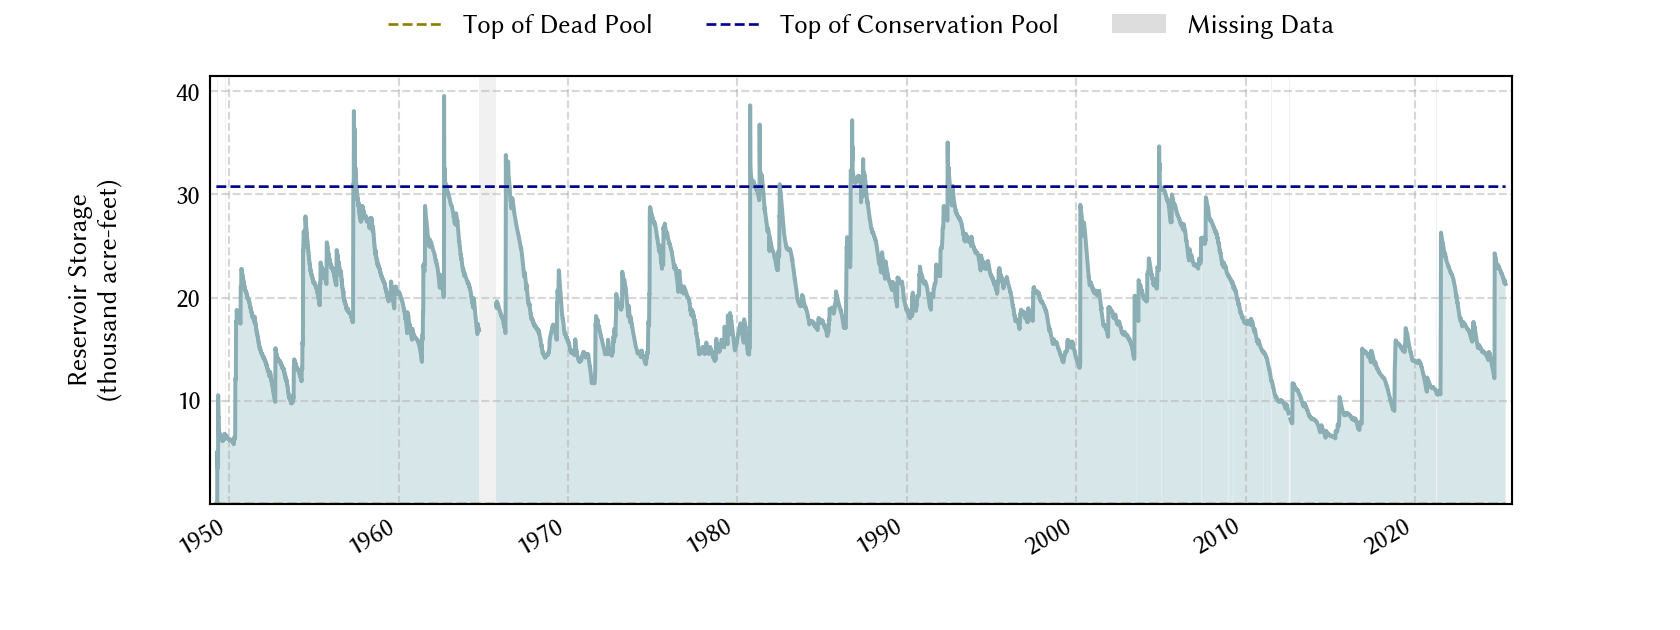
| Impoundment date | 1949-01-01 |
| Vertical datum | NGVD29 |
| Dead pool elevation | 2,024.30 ft above NGVD29 |
| Service spillway crest elevation | 2,070.20 ft above NGVD29 |
| Emergency spillway crest elevation | 2,073.40 ft above NGVD29 |
| Top of dam elevation | 2,090.00 ft above NGVD29 |
| Conservation pool elevation | 2,070.20 ft above NGVD29 |
| Data download (CSV) | period of record, last one year, last 30 days |
Elevation-Area-Capacity Curves |
|
| Data Source | USGS:08123000 |
| USGS Monitoring Location | USGS:08123000 |
Lake Location