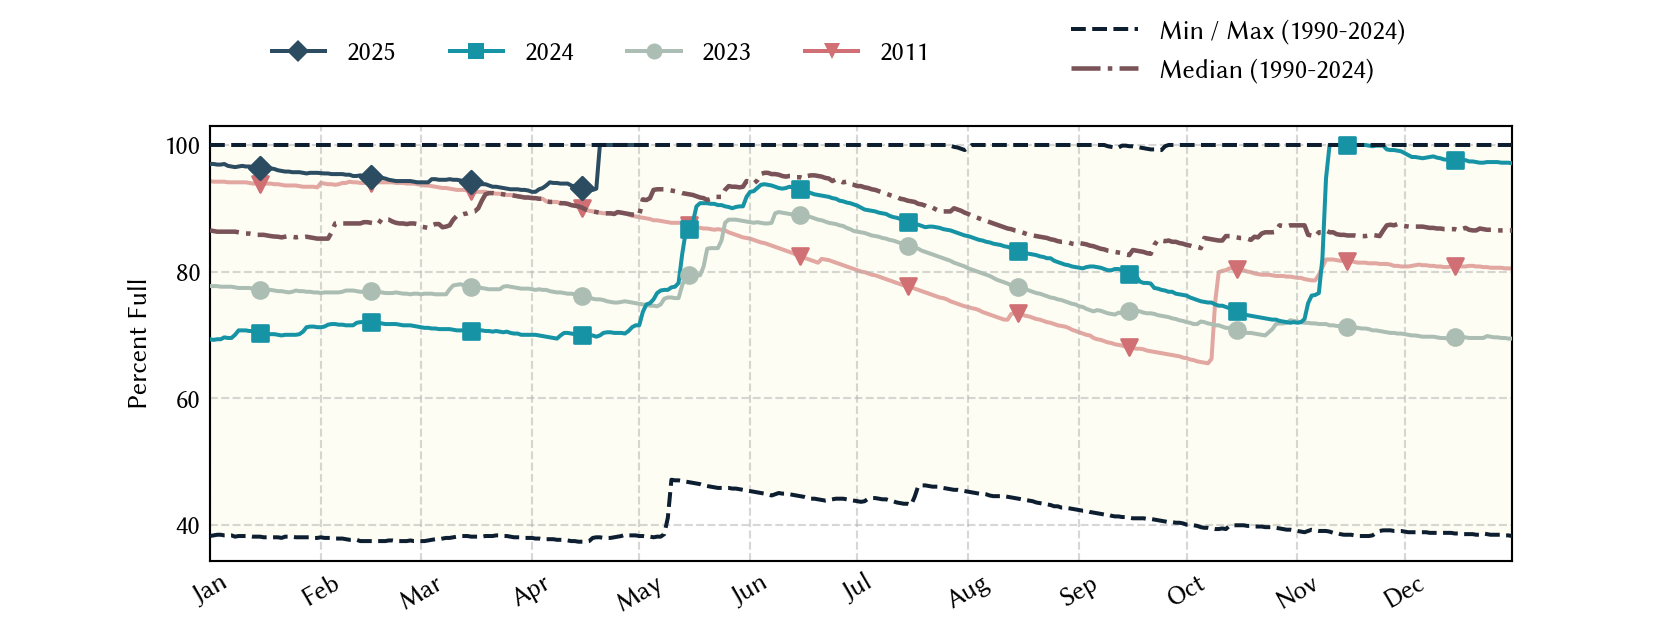
Lake Graham: 73.4% full as of 2026-07-30
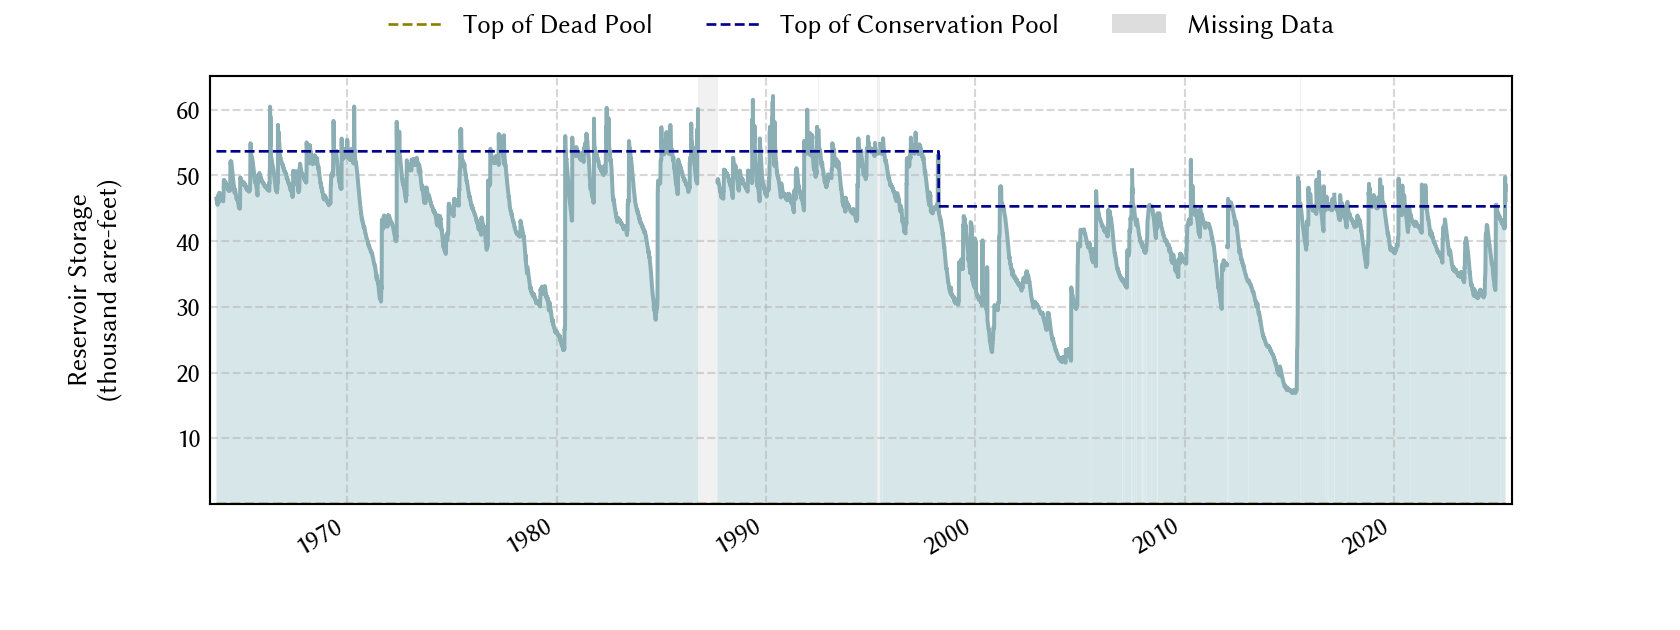
Historical Data
| Date | Percent Full |
Mean Water Level (ft) |
Reservoir Storage (acre-ft) |
Conservation Storage (acre-ft) |
Conservation Capacity (acre-ft) |
Surface Area (acres) |
|
|---|---|---|---|---|---|---|---|
| Today | 2026-07-30 | 73.4 | 1,069.74 | 33,276 | 33,262 | 45,288 | 2,064 |
| Yesterday | 2026-07-29 | 73.5 | 1,069.76 | 33,317 | 33,303 | 45,288 | 2,066 |
| 2 days ago | 2026-07-28 | 73.7 | 1,069.79 | 33,379 | 33,365 | 45,288 | 2,068 |
| 1 week ago | 2026-07-23 | 75.0 | 1,070.07 | 33,962 | 33,948 | 45,288 | 2,100 |
| 1 month ago | 2026-06-30 | 76.8 | 1,070.46 | 34,787 | 34,773 | 45,288 | 2,132 |
| 3 months ago | 2026-04-30 | 79.1 | 1,070.95 | 35,842 | 35,828 | 45,288 | 2,166 |
| 6 months ago | 2026-01-30 | 77.8 | 1,070.67 | 35,236 | 35,222 | 45,288 | 2,147 |
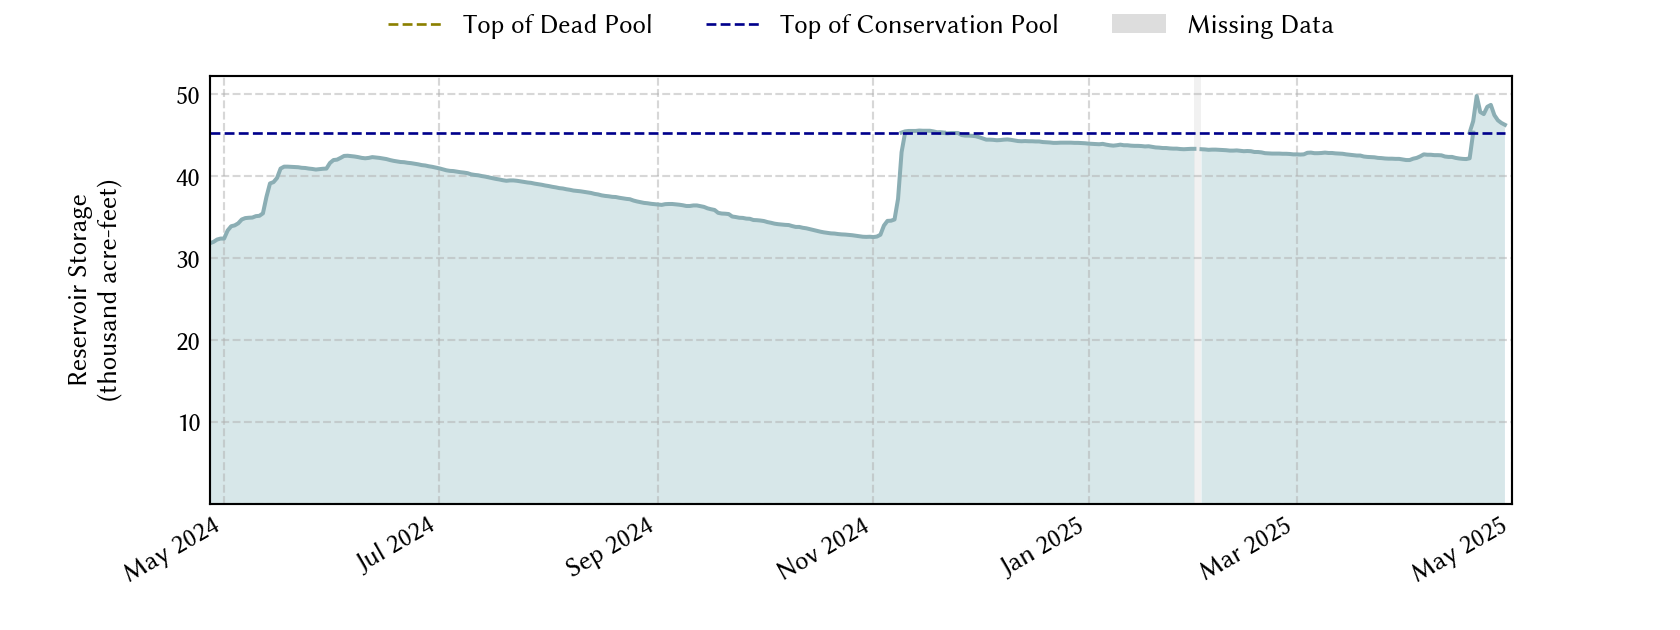
| 1 year ago | 2025-07-30 | 93.9 | 1,073.86 | 42,526 | 42,512 | 45,288 | 2,366 |
*
Percent Full is based on Conservation Storage and Conservation Capacity and doesn't account for storage in flood pool.
**
Values above, including today's are averaged conditions. For near real-time instantaneous water level, see table below or the interactive map viewer.
Most Recent Instantaneous Water Level
| Date/time |
Water Level (ft) |
Conservation Pool Elevation (ft) |
Height Above Conservation Pool (ft) |
|
|---|---|---|---|---|
| Most recent | 2026-07-30 17:00 | 1,069.72 | 1,075.00 | -5.28 |
| 1 hour prior | 2026-07-30 16:00 | 1,069.72 | 1,075.00 | -5.28 |
| 2 hours prior | 2026-07-30 15:00 | 1,069.72 | 1,075.00 | -5.28 |
| 6 hours prior | 2026-07-30 11:00 | 1,069.74 | 1,075.00 | -5.26 |
| 12 hours prior | 2026-07-30 05:00 | 1,069.74 | 1,075.00 | -5.26 |
| 24 hours prior | 2026-07-29 17:00 | 1,069.75 | 1,075.00 | -5.25 |
| 48 hours prior | 2026-07-28 17:00 | 1,069.78 | 1,075.00 | -5.22 |
*
Data is provisional and subject to revision.
Additional Information
| Impoundment date | 1958-01-01 |
| Vertical datum | NGVD29 +1.3 |
| Dead pool elevation | 1,030.00 ft above NGVD29 +1.3 |
| Service spillway crest elevation | 1,076.30 ft above NGVD29 |
| Top of dam elevation | 1,093.30 ft above NGVD29 |
| Conservation pool elevation | 1,075.00 ft above NGVD29 +1.3 |
| Data download (CSV) | period of record, last one year, last 30 days |
| Data Source | USGS:08088400 |
| USGS Monitoring Location | USGS:08088400 |
Lake Location
