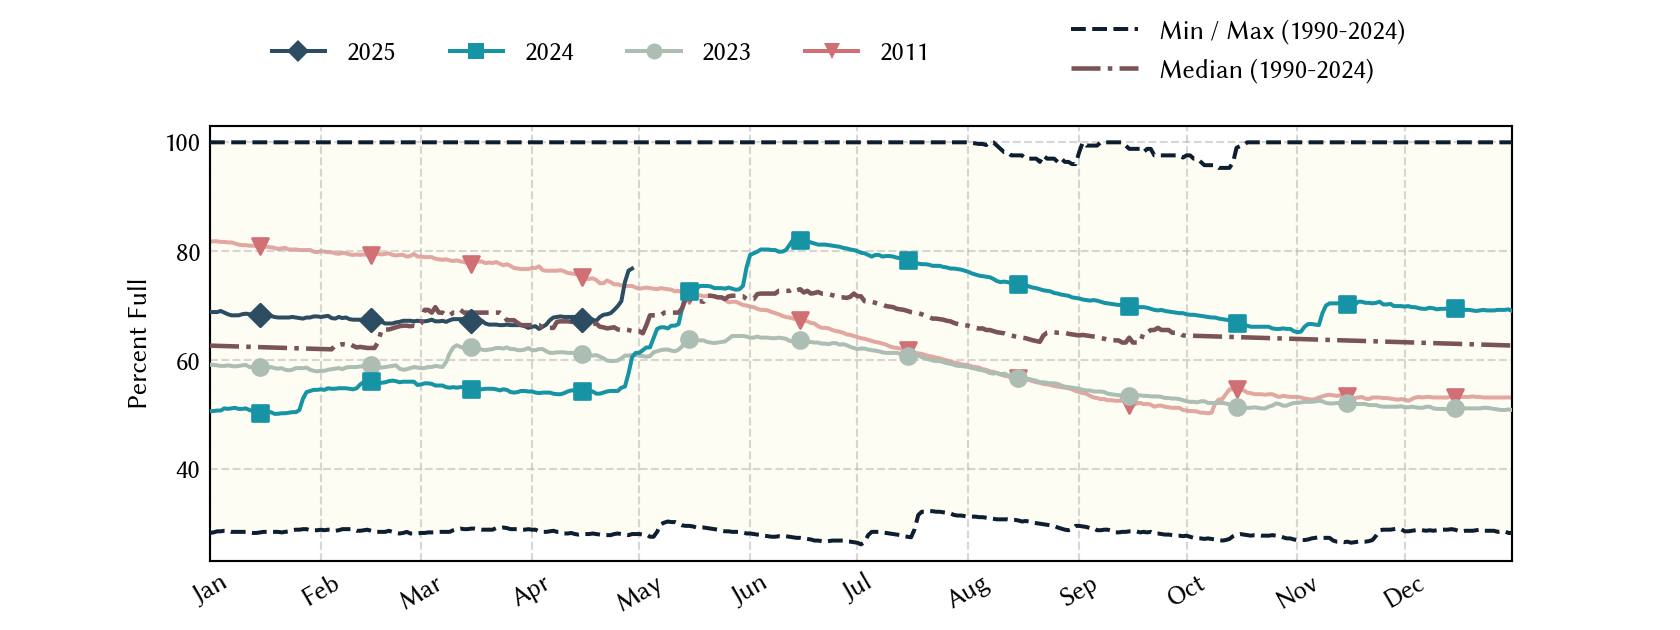
Lake Kickapoo: 85.6% full as of 2026-08-02
Historical Data
| Date | Percent Full |
Mean Water Level (ft) |
Reservoir Storage (acre-ft) |
Conservation Storage (acre-ft) |
Conservation Capacity (acre-ft) |
Surface Area (acres) |
|
|---|---|---|---|---|---|---|---|
| Today | 2026-08-02 | 85.6 | 1,042.78 | 73,887 | 73,887 | 86,345 | 5,359 |
| Yesterday | 2026-08-01 | 85.8 | 1,042.81 | 74,048 | 74,048 | 86,345 | 5,366 |
| 2 days ago | 2026-07-31 | 86.1 | 1,042.86 | 74,317 | 74,317 | 86,345 | 5,377 |
| 1 week ago | 2026-07-26 | 86.9 | 1,042.99 | 75,018 | 75,018 | 86,345 | 5,407 |
| 1 month ago | 2026-07-02 | 88.9 | 1,043.31 | 76,760 | 76,760 | 86,345 | 5,480 |
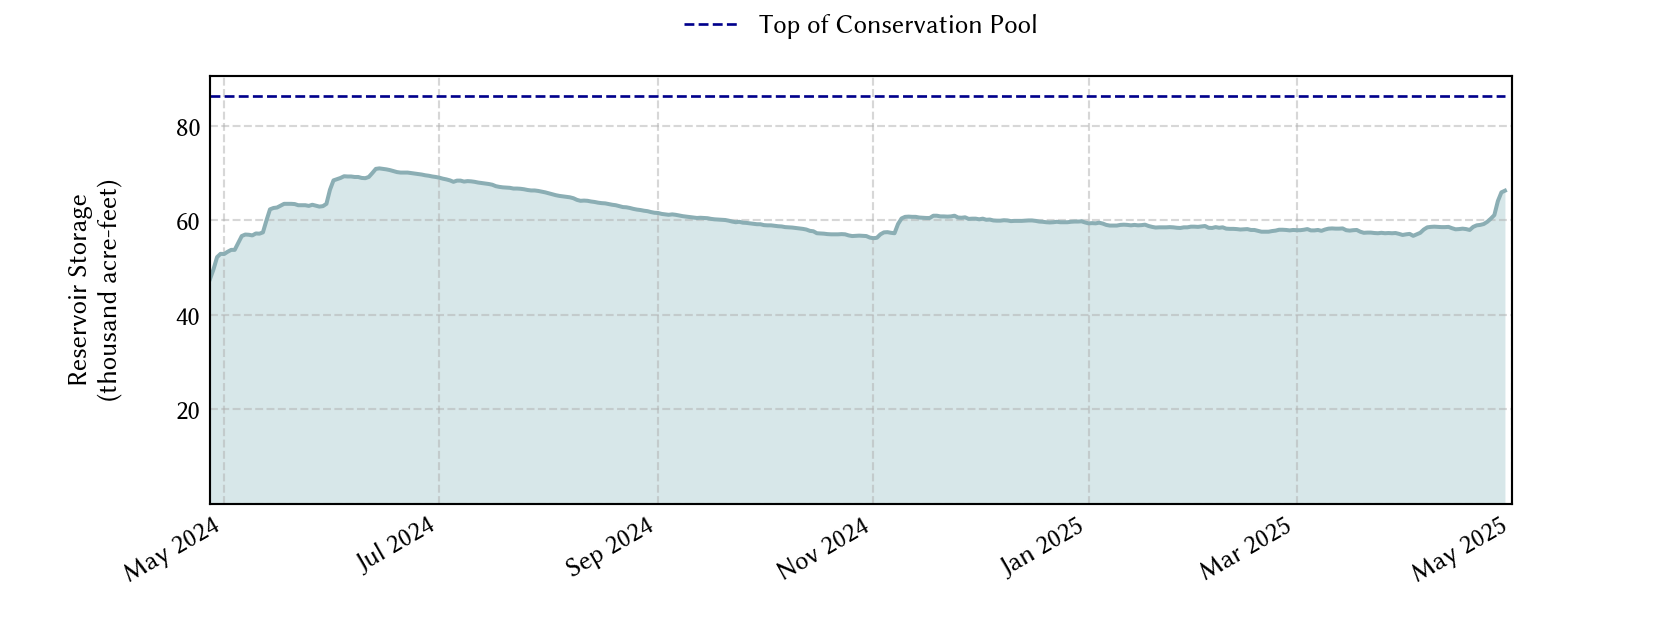
| 3 months ago | 2026-05-02 | 87.1 | 1,043.03 | 75,234 | 75,234 | 86,345 | 5,416 |
| 6 months ago | 2026-02-02 | 84.6 | 1,042.62 | 73,033 | 73,033 | 86,345 | 5,323 |
| 1 year ago | 2025-08-02 | 98.4 | 1,044.77 | 85,002 | 85,002 | 86,345 | 5,811 |
*
Percent Full is based on Conservation Storage and Conservation Capacity and doesn't account for storage in flood pool.
**
Values above, including today's are averaged conditions. For near real-time instantaneous water level, see table below or the interactive map viewer.
Most Recent Instantaneous Water Level
| Date/time |
Water Level (ft) |
Conservation Pool Elevation (ft) |
Height Above Conservation Pool (ft) |
|
|---|---|---|---|---|
| Most recent | 2026-08-02 16:00 | 1,042.79 | 1,045.00 | -2.21 |
| 1 hour prior | 2026-08-02 15:00 | 1,042.79 | 1,045.00 | -2.21 |
| 2 hours prior | 2026-08-02 14:00 | 1,042.79 | 1,045.00 | -2.21 |
| 6 hours prior | 2026-08-02 10:00 | 1,042.84 | 1,045.00 | -2.16 |
| 12 hours prior | 2026-08-02 04:00 | 1,042.75 | 1,045.00 | -2.25 |
| 24 hours prior | 2026-08-01 16:00 | - n.a. - | - n.a. - | - n.a. - |
| 48 hours prior | 2026-07-31 16:00 | 1,042.86 | 1,045.00 | -2.14 |
*
Data is provisional and subject to revision.
Additional Information
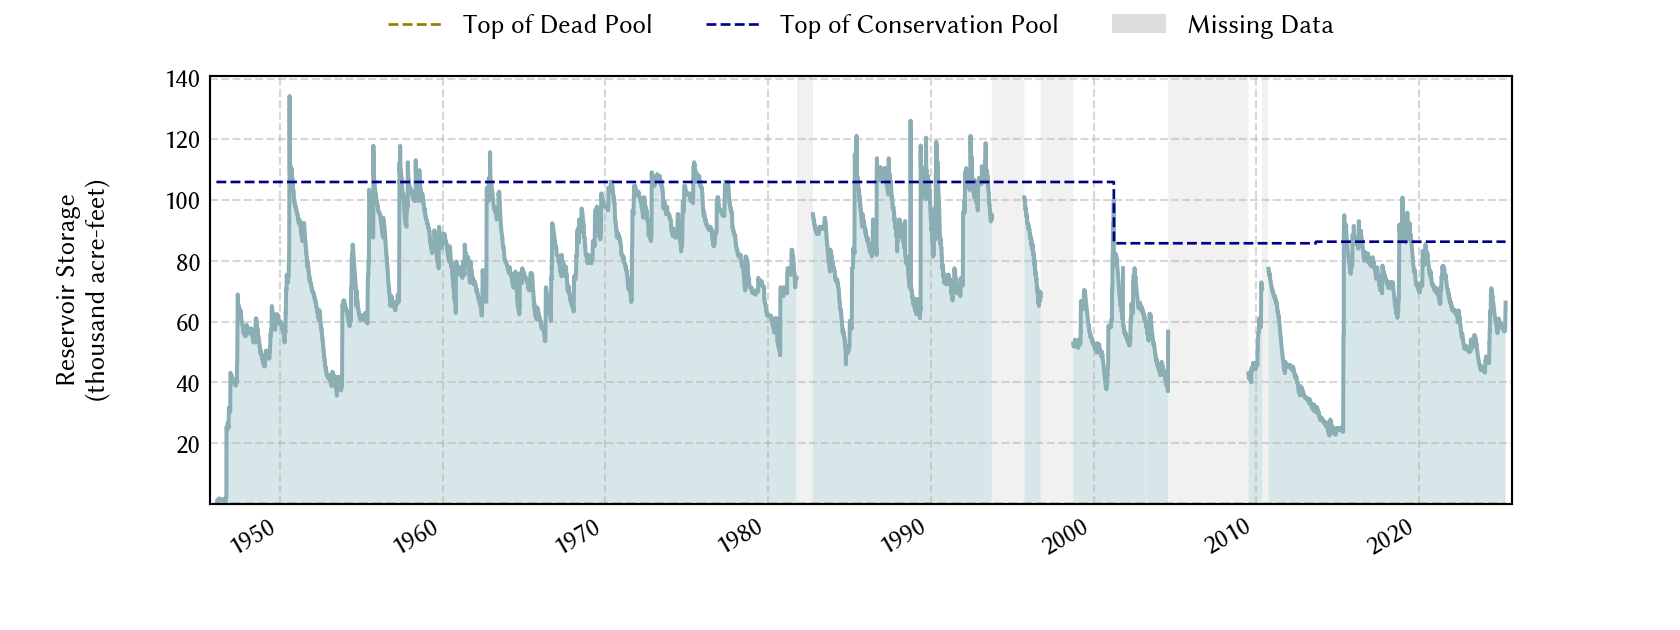
| Impoundment date | 1945-01-01 |
| Vertical datum | NGVD29 |
| Dead pool elevation | 1,000.92 ft above NGVD29 |
| Service spillway crest elevation | 1,045.00 ft above NGVD29 |
| Emergency spillway crest elevation | 1,060.00 ft above NGVD29 |
| Maximum design elevation | 1,060.00 ft above NGVD29 |
| Top of dam elevation | 1,059.00 ft above NGVD29 |
| Conservation pool elevation | 1,045.00 ft above NGVD29 |
| Data download (CSV) | period of record, last one year, last 30 days |
Elevation-Area-Capacity Curves
1945-01-01 (source: USGS)
2001-04-01 (source: TWDB)
: GIS Data
2013-09-01 (source: TWDB)
: GIS Data
|
|
| Data Source | USGS:07314000 |
| USGS Monitoring Location | USGS:07314000 |
Lake Location