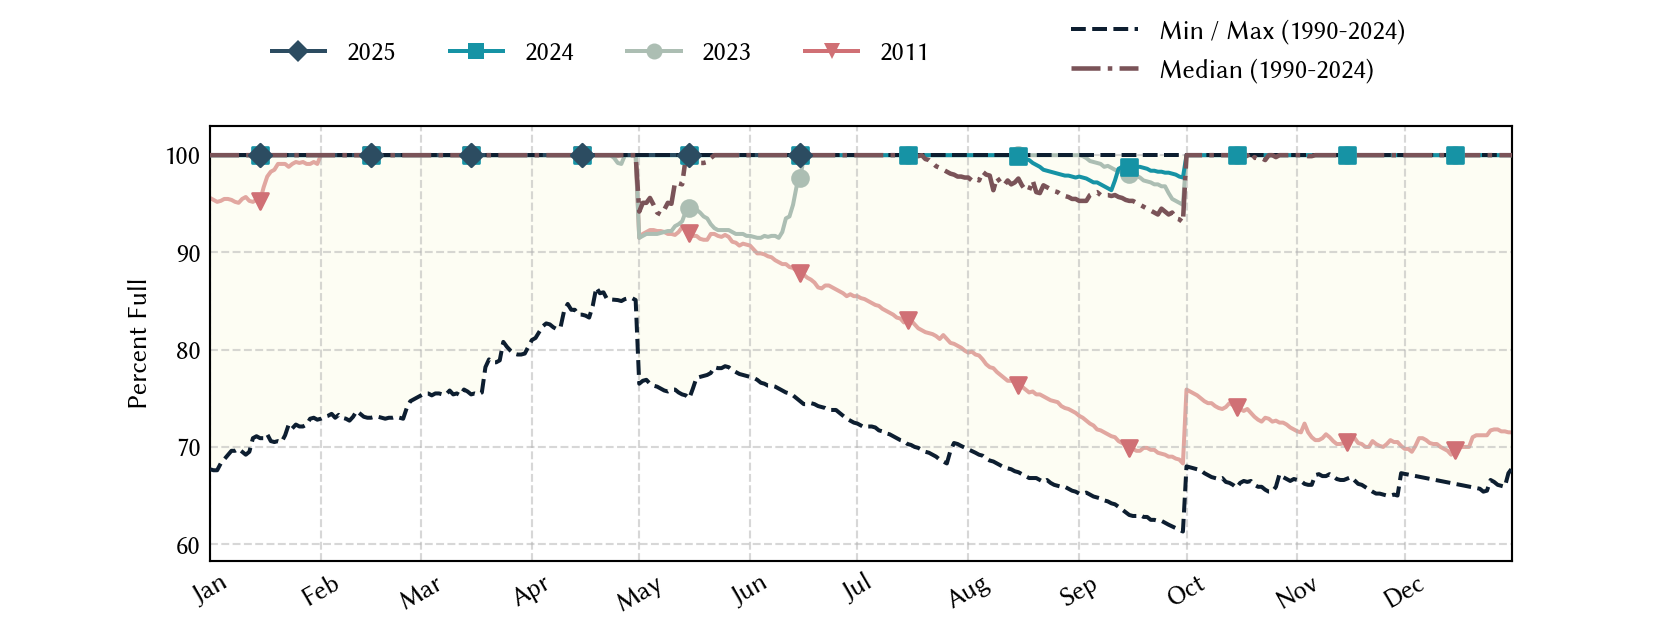
Lake O the Pines: 93.5% full as of 2026-07-29
Historical Data
| Date | Percent Full |
Mean Water Level (ft) |
Reservoir Storage (acre-ft) |
Conservation Storage (acre-ft) |
Conservation Capacity (acre-ft) |
Surface Area (acres) |
|
|---|---|---|---|---|---|---|---|
| Today | 2026-07-29 | 93.5 | 229.04 | 250,983 | 250,983 | 268,566 | - n.a. - |
| Yesterday | 2026-07-28 | 93.5 | 229.05 | 251,163 | 251,163 | 268,566 | - n.a. - |
| 2 days ago | 2026-07-27 | 93.7 | 229.07 | 251,523 | 251,523 | 268,566 | - n.a. - |
| 1 week ago | 2026-07-22 | 94.6 | 229.21 | 254,051 | 254,051 | 268,566 | - n.a. - |
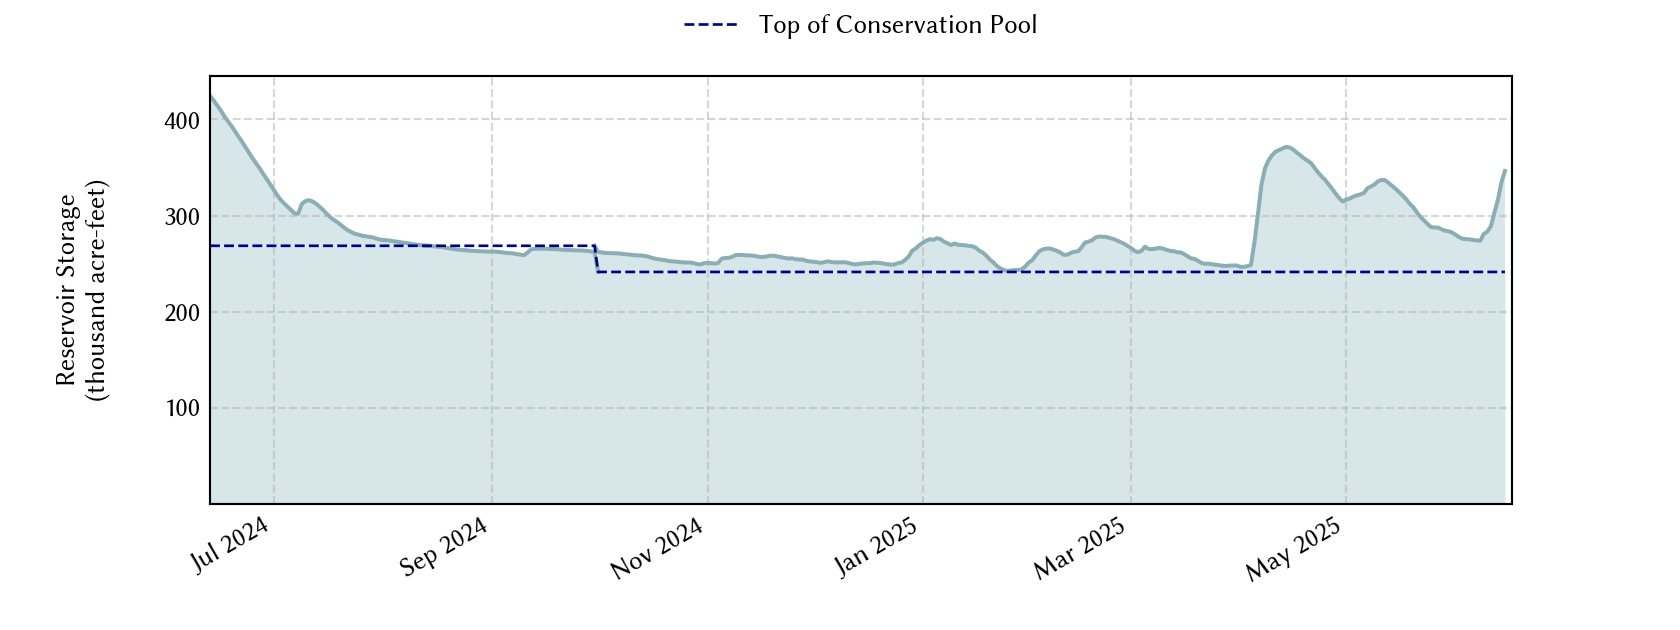
| 1 month ago | 2026-06-29 | 94.1 | 229.13 | 252,605 | 252,605 | 268,566 | - n.a. - |
| 3 months ago | 2026-04-29 | 100.0 | 228.58 | 242,776 | 241,363 | 241,363 | 17,691 |
| 6 months ago | 2026-01-29 | 99.5 | 228.43 | 240,130 | 240,130 | 241,363 | 17,589 |
| 1 year ago | 2025-07-29 | 100.0 | 230.03 | 269,126 | 268,566 | 268,566 | - n.a. - |
*
Percent Full is based on Conservation Storage and Conservation Capacity and doesn't account for storage in flood pool.
**
Values above, including today's are averaged conditions. For near real-time instantaneous water level, see table below or the interactive map viewer.
Most Recent Instantaneous Water Level
| Date/time |
Water Level (ft) |
Conservation Pool Elevation (ft) |
Height Above Conservation Pool (ft) |
|
|---|---|---|---|---|
| Most recent | 2026-07-29 15:30 | 229.02 | 230.00 | -0.98 |
| 1 hour prior | 2026-07-29 14:30 | 229.02 | 230.00 | -0.98 |
| 2 hours prior | 2026-07-29 13:30 | 229.03 | 230.00 | -0.97 |
| 6 hours prior | 2026-07-29 09:30 | 229.04 | 230.00 | -0.96 |
| 12 hours prior | 2026-07-29 03:30 | 229.03 | 230.00 | -0.97 |
| 24 hours prior | 2026-07-28 15:30 | 229.04 | 230.00 | -0.96 |
| 48 hours prior | 2026-07-27 15:30 | 229.06 | 230.00 | -0.94 |
*
Data is provisional and subject to revision.
Additional Information
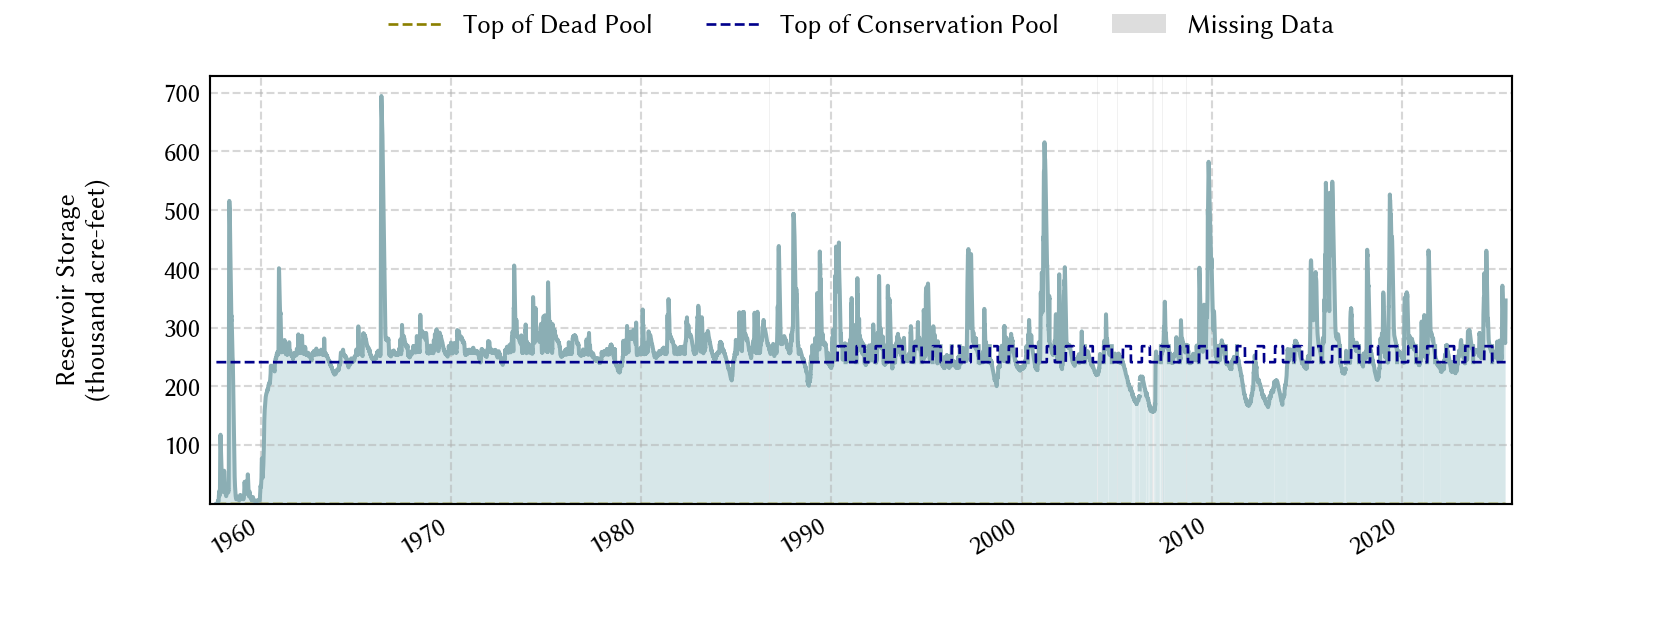
| Impoundment date | 1958-01-01 |
| Vertical datum | NGVD29 |
| Emergency spillway crest elevation | 249.50 ft above NGVD29 |
| Flood pool elevation | 249.50 ft above NGVD29 |
| Maximum design elevation | 269.90 ft above NGVD29 |
| Top of dam elevation | 277.00 ft above NGVD29 |
|
Conservation pool elevation |
230.00 ft above NGVD29 |
|
Conservation pool elevation |
228.50 ft above NGVD29 |
|
Conservation pool elevation |
228.50 ft above NGVD29 |
|
Conservation pool elevation |
228.50 ft above NGVD29 |
| Data download (CSV) | period of record, last one year, last 30 days |
| Data Source | USGS:07345900 |
| USGS Monitoring Location | USGS:07345900 |
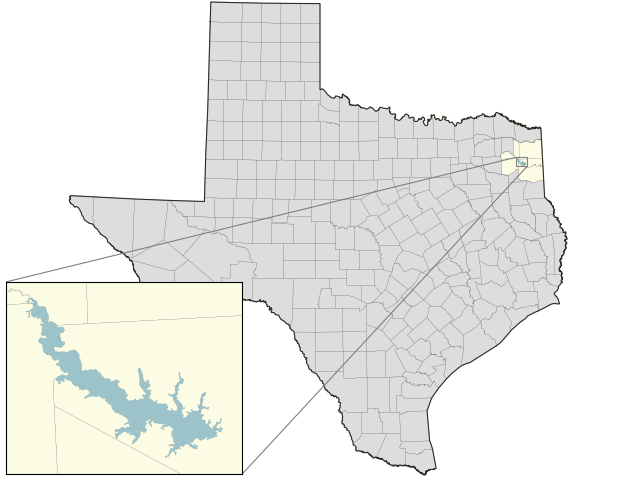
Lake Location