Lavon Lake: 95.4% full as of 2026-08-02
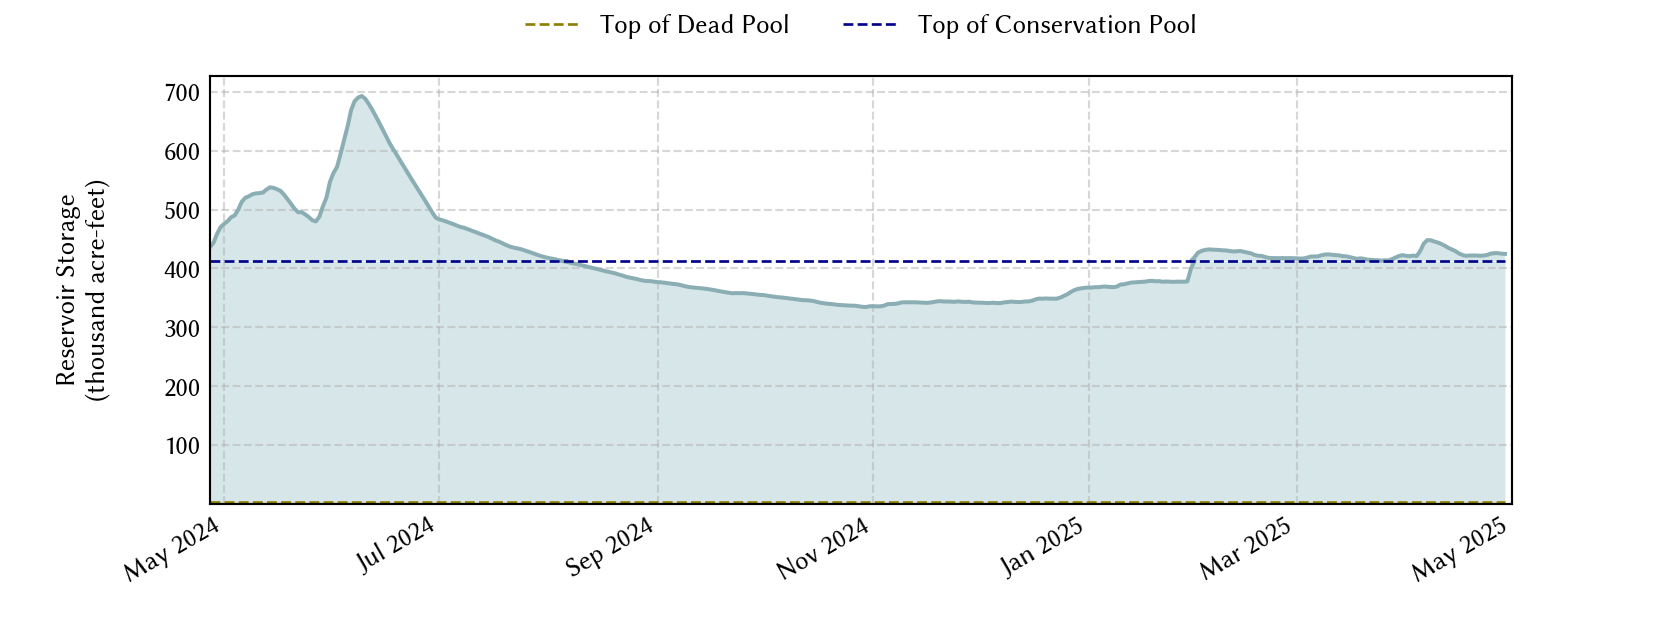
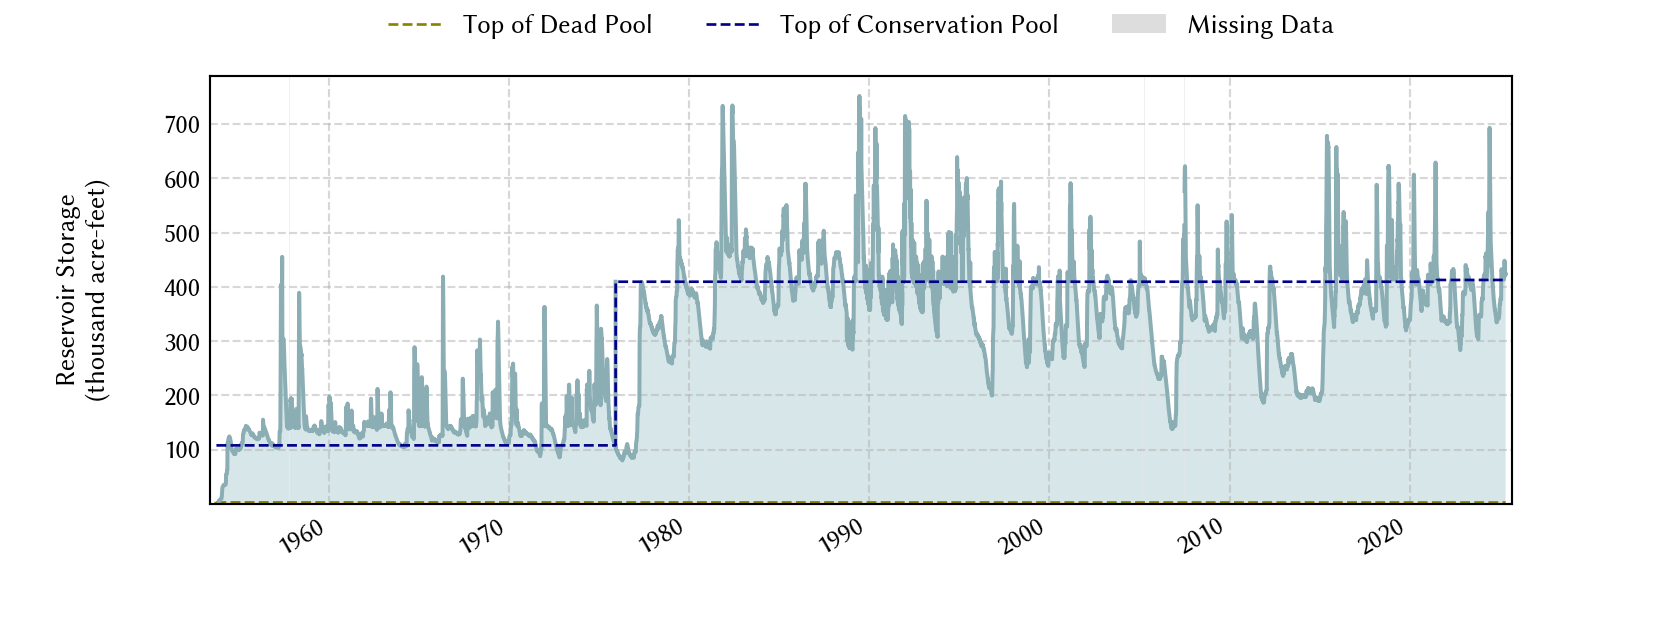
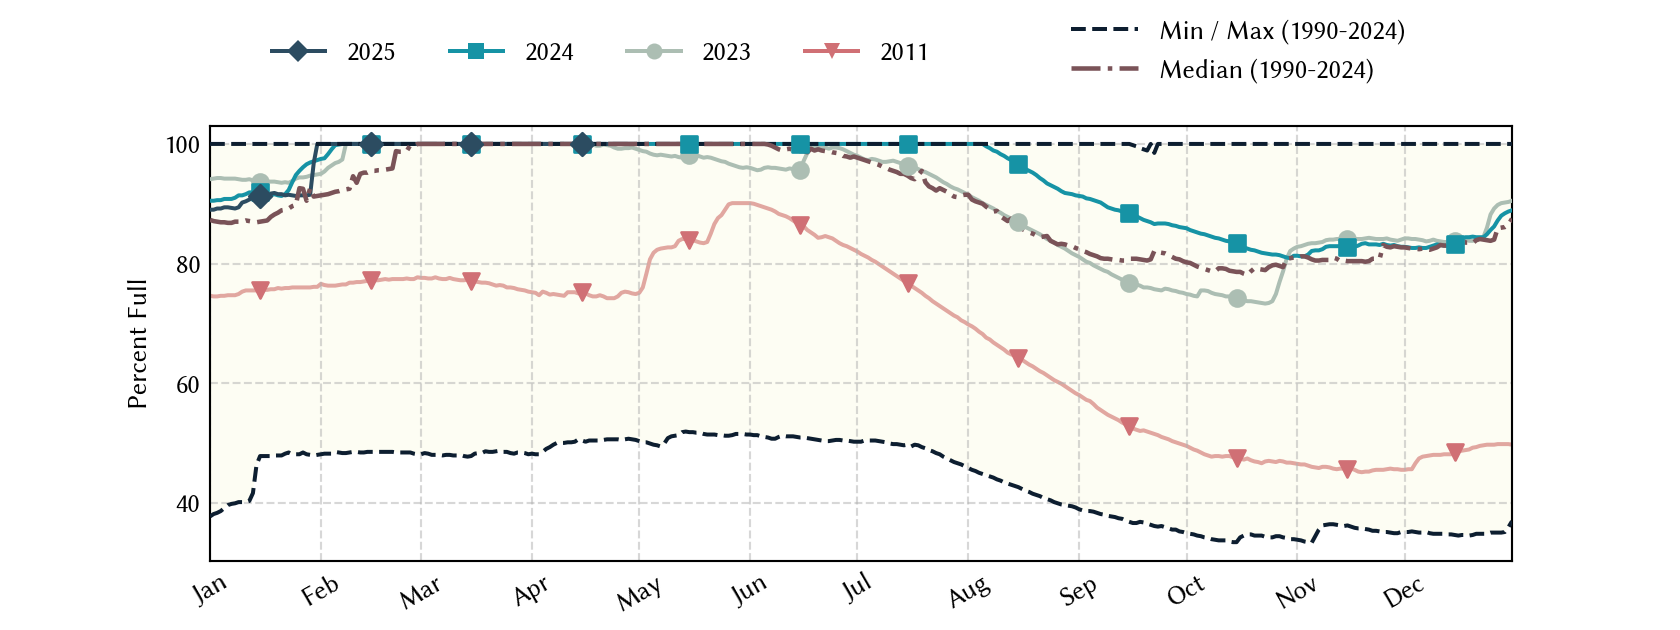
Historical Data
| Date | Percent Full |
Mean Water Level (ft) |
Reservoir Storage (acre-ft) |
Conservation Storage (acre-ft) |
Conservation Capacity (acre-ft) |
Surface Area (acres) |
|
|---|---|---|---|---|---|---|---|
| Today | 2026-08-02 | 95.4 | 491.08 | 393,812 | 390,971 | 409,757 | 20,234 |
| Yesterday | 2026-08-01 | 95.7 | 491.14 | 395,027 | 392,186 | 409,757 | 20,257 |
| 2 days ago | 2026-07-31 | 96.0 | 491.19 | 396,040 | 393,199 | 409,757 | 20,276 |
| 1 week ago | 2026-07-26 | 97.7 | 491.55 | 403,365 | 400,524 | 409,757 | 20,419 |
| 1 month ago | 2026-07-02 | 100.0 | 492.45 | 421,946 | 409,757 | 409,757 | 20,904 |
| 3 months ago | 2026-05-02 | 100.0 | 492.39 | 420,693 | 409,757 | 409,757 | 20,879 |
| 6 months ago | 2026-02-02 | 89.7 | 489.91 | 370,344 | 367,503 | 409,757 | 19,767 |
| 1 year ago | 2025-08-02 | 96.4 | 491.27 | 397,663 | 394,822 | 409,757 | 20,307 |
*
Percent Full is based on Conservation Storage and Conservation Capacity and doesn't account for storage in flood pool.
**
Values above, including today's are averaged conditions. For near real-time instantaneous water level, see table below or the interactive map viewer.
Most Recent Instantaneous Water Level
| Date/time |
Water Level (ft) |
Conservation Pool Elevation (ft) |
Height Above Conservation Pool (ft) |
|
|---|---|---|---|---|
| Most recent | 2026-08-02 16:00 | 491.03 | 492.00 | -0.97 |
| 1 hour prior | 2026-08-02 15:00 | 491.04 | 492.00 | -0.96 |
| 2 hours prior | 2026-08-02 14:00 | 491.04 | 492.00 | -0.96 |
| 6 hours prior | 2026-08-02 10:00 | 491.06 | 492.00 | -0.94 |
| 12 hours prior | 2026-08-02 04:00 | 491.08 | 492.00 | -0.92 |
| 24 hours prior | 2026-08-01 16:00 | 491.13 | 492.00 | -0.87 |
| 48 hours prior | 2026-07-31 16:00 | 491.17 | 492.00 | -0.83 |
*
Data is provisional and subject to revision.
Additional Information
| Impoundment date | 1953-01-01 |
| Vertical datum | NGVD29 |
| Dead pool elevation | 453.00 ft above NGVD29 |
| Service spillway crest elevation | 475.50 ft above NGVD29 |
| Top of flood gate elevation | 503.50 ft above NGVD29 |
| Emergency spillway crest elevation | 503.50 ft above NGVD29 |
| Flood pool elevation | 503.50 ft above NGVD29 |
| Maximum design elevation | 509.00 ft above NGVD29 |
| Top of dam elevation | 514.00 ft above NGVD29 |
|
Conservation pool elevation |
492.00 ft above NGVD29 |
|
Conservation pool elevation |
472.00 ft above NGVD29 |
| Data download (CSV) | period of record, last one year, last 30 days |
Elevation-Area-Capacity Curves
2011-07-01 (source: TWDB)
: GIS Data
2021-07-01 (source: TWDB)
: GIS Data
|
|
| Data Source | USGS:08060500 |
| USGS Monitoring Location | USGS:08060500 |
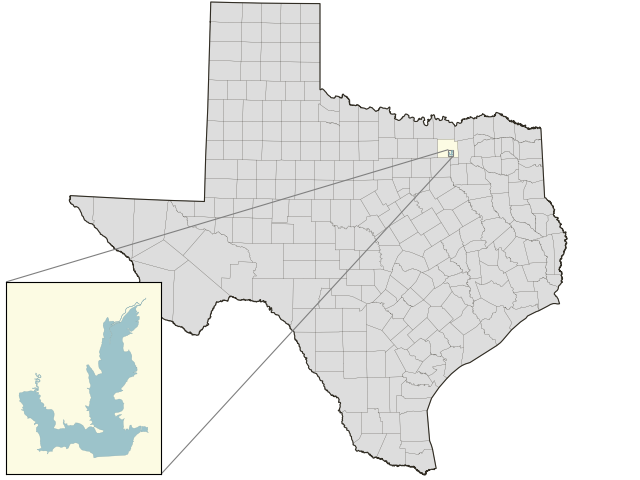
Lake Location