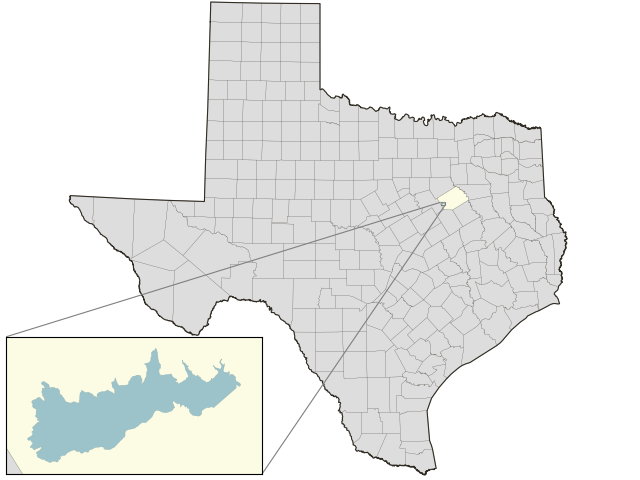
Navarro Mills Lake: 92.0% full as of 2026-08-02
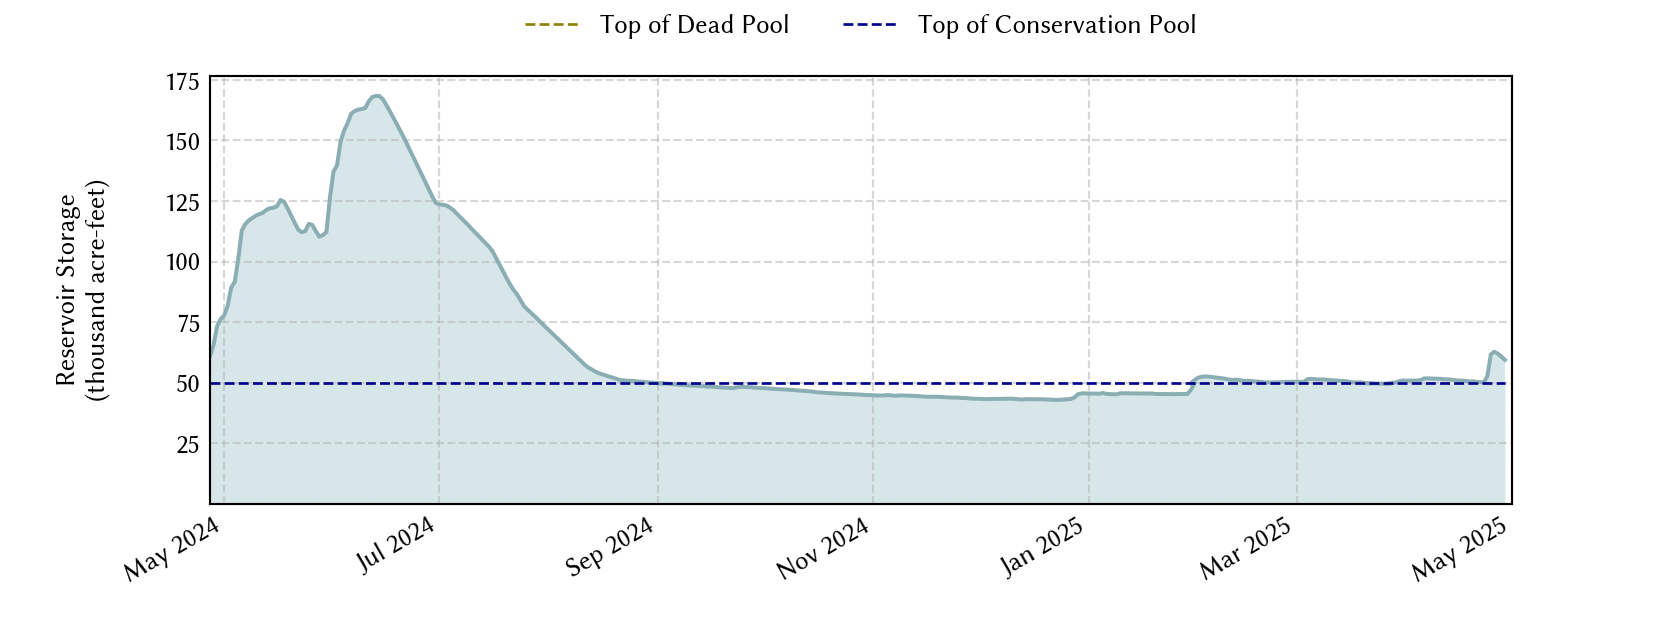
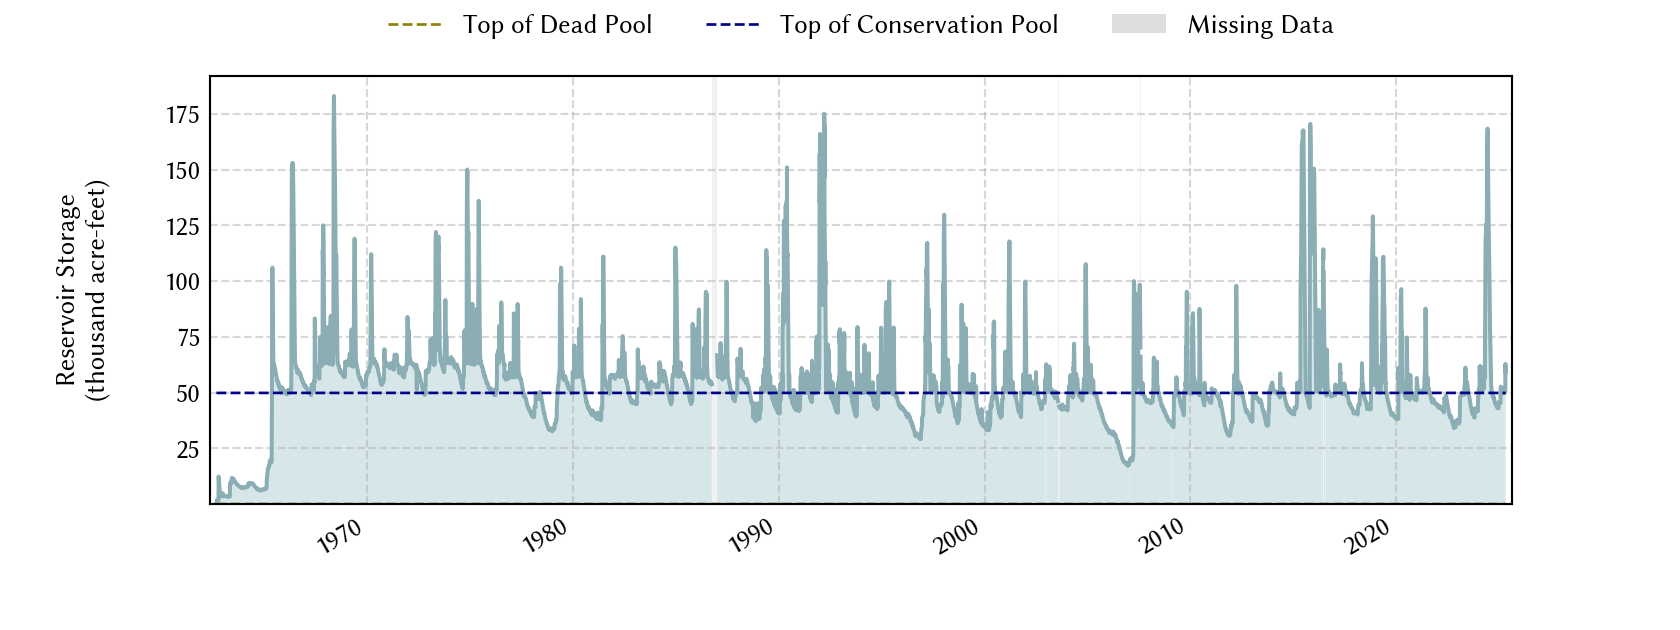
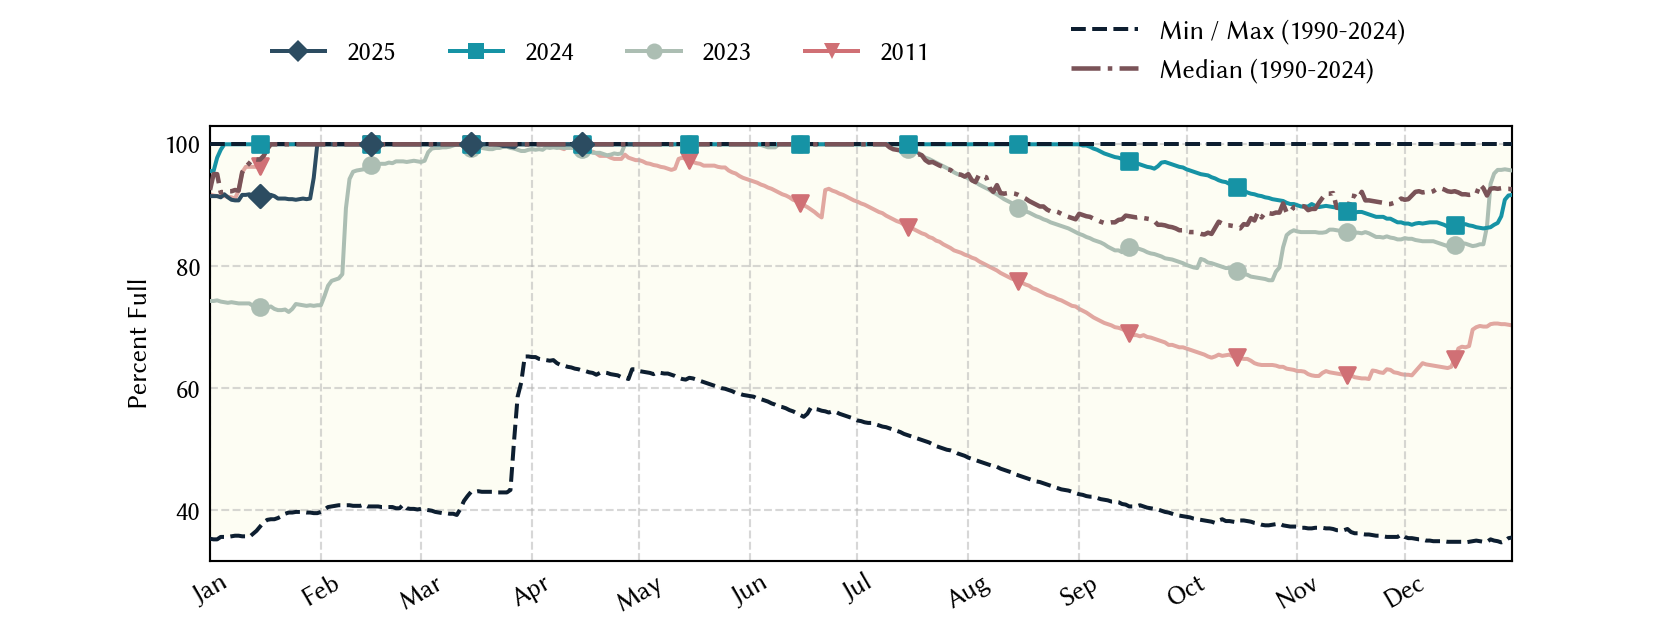
Historical Data
| Date | Percent Full |
Mean Water Level (ft) |
Reservoir Storage (acre-ft) |
Conservation Storage (acre-ft) |
Conservation Capacity (acre-ft) |
Surface Area (acres) |
|
|---|---|---|---|---|---|---|---|
| Today | 2026-08-02 | 92.0 | 423.64 | 45,855 | 45,854 | 49,827 | 4,538 |
| Yesterday | 2026-08-01 | 92.3 | 423.67 | 45,991 | 45,990 | 49,827 | 4,544 |
| 2 days ago | 2026-07-31 | 92.6 | 423.70 | 46,127 | 46,126 | 49,827 | 4,549 |
| 1 week ago | 2026-07-26 | 94.0 | 423.86 | 46,857 | 46,856 | 49,827 | 4,578 |
| 1 month ago | 2026-07-02 | 98.4 | 424.33 | 49,030 | 49,029 | 49,827 | 4,671 |
| 3 months ago | 2026-05-02 | 100.0 | 424.50 | 49,827 | 49,826 | 49,827 | 4,736 |
| 6 months ago | 2026-02-02 | 97.7 | 424.26 | 48,704 | 48,703 | 49,827 | 4,656 |
| 1 year ago | 2025-08-02 | 100.0 | 424.61 | 50,346 | 49,827 | 49,827 | - n.a. - |
*
Percent Full is based on Conservation Storage and Conservation Capacity and doesn't account for storage in flood pool.
**
Values above, including today's are averaged conditions. For near real-time instantaneous water level, see table below or the interactive map viewer.
Most Recent Instantaneous Water Level
| Date/time |
Water Level (ft) |
Conservation Pool Elevation (ft) |
Height Above Conservation Pool (ft) |
|
|---|---|---|---|---|
| Most recent | 2026-08-02 16:00 | 423.63 | 424.50 | -0.87 |
| 1 hour prior | 2026-08-02 15:00 | 423.63 | 424.50 | -0.87 |
| 2 hours prior | 2026-08-02 14:00 | 423.63 | 424.50 | -0.87 |
| 6 hours prior | 2026-08-02 10:00 | 423.63 | 424.50 | -0.87 |
| 12 hours prior | 2026-08-02 04:00 | 423.64 | 424.50 | -0.86 |
| 24 hours prior | 2026-08-01 16:00 | 423.65 | 424.50 | -0.85 |
| 48 hours prior | 2026-07-31 16:00 | 423.70 | 424.50 | -0.80 |
*
Data is provisional and subject to revision.
Additional Information
| Impoundment date | 1963-01-01 |
| Vertical datum | NGVD29 |
| Dead pool elevation | 400.00 ft above NGVD29 |
| Service spillway crest elevation | 414.00 ft above NGVD29 |
| Top of flood gate elevation | 443.00 ft above NGVD29 |
| Emergency spillway crest elevation | 443.00 ft above NGVD29 |
| Flood pool elevation | 443.00 ft above NGVD29 |
| Maximum design elevation | 451.90 ft above NGVD29 |
| Top of dam elevation | 457.00 ft above NGVD29 |
| Conservation pool elevation | 424.50 ft above NGVD29 |
| Data download (CSV) | period of record, last one year, last 30 days |
Elevation-Area-Capacity Curves
2008-04-01 (source: TWDB)
: GIS Data
|
|
| Data Source | USGS:08063050 |
| USGS Monitoring Location | USGS:08063050 |
Lake Location