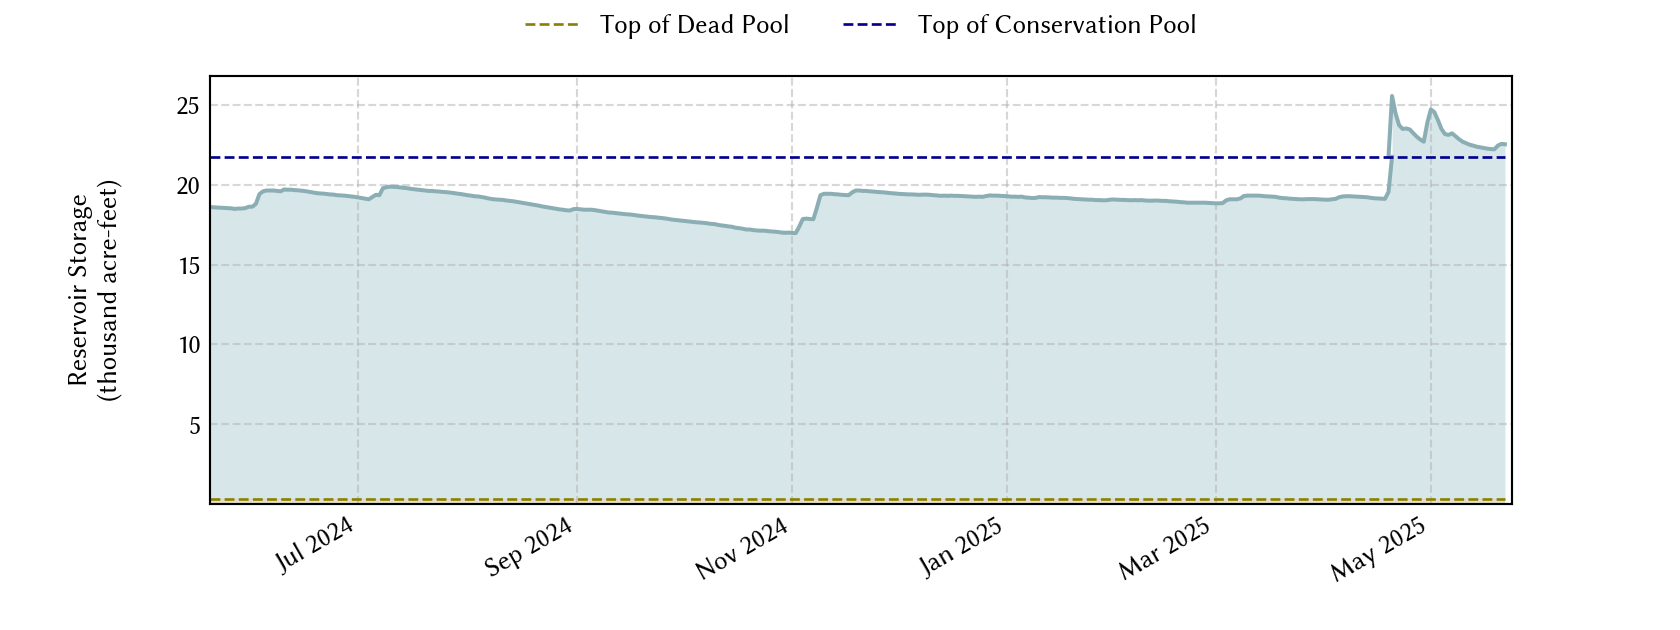
Lake Nocona (Farmer's Creek): 79.3% full as of 2026-08-02
Historical Data
| Date | Percent Full |
Mean Water Level (ft) |
Reservoir Storage (acre-ft) |
Conservation Storage (acre-ft) |
Conservation Capacity (acre-ft) |
Surface Area (acres) |
|
|---|---|---|---|---|---|---|---|
| Today | 2026-08-02 | 79.3 | 824.02 | 17,303 | 16,999 | 21,444 | 1,210 |
| Yesterday | 2026-08-01 | 79.4 | 824.05 | 17,339 | 17,035 | 21,444 | 1,212 |
| 2 days ago | 2026-07-31 | 79.6 | 824.08 | 17,376 | 17,072 | 21,444 | 1,213 |
| 1 week ago | 2026-07-26 | 80.5 | 824.23 | 17,558 | 17,254 | 21,444 | 1,220 |
| 1 month ago | 2026-07-02 | 83.6 | 824.77 | 18,223 | 17,919 | 21,444 | 1,242 |
| 3 months ago | 2026-05-02 | 86.2 | 825.22 | 18,785 | 18,481 | 21,444 | 1,258 |
| 6 months ago | 2026-02-02 | 86.1 | 825.20 | 18,760 | 18,456 | 21,444 | 1,258 |
| 1 year ago | 2025-08-02 | 97.3 | 827.06 | 21,162 | 20,858 | 21,444 | 1,325 |
*
Percent Full is based on Conservation Storage and Conservation Capacity and doesn't account for storage in flood pool.
**
Values above, including today's are averaged conditions. For near real-time instantaneous water level, see table below or the interactive map viewer.
Most Recent Instantaneous Water Level
| Date/time |
Water Level (ft) |
Conservation Pool Elevation (ft) |
Height Above Conservation Pool (ft) |
|
|---|---|---|---|---|
| Most recent | 2026-08-02 15:00 | 824.01 | 827.50 | -3.49 |
| 1 hour prior | 2026-08-02 14:00 | 824.01 | 827.50 | -3.49 |
| 2 hours prior | 2026-08-02 13:00 | 824.01 | 827.50 | -3.49 |
| 6 hours prior | 2026-08-02 09:00 | 824.01 | 827.50 | -3.49 |
| 12 hours prior | 2026-08-02 03:00 | 824.02 | 827.50 | -3.48 |
| 24 hours prior | 2026-08-01 15:00 | 824.05 | 827.50 | -3.45 |
| 48 hours prior | 2026-07-31 15:00 | 824.07 | 827.50 | -3.43 |
*
Data is provisional and subject to revision.
Additional Information
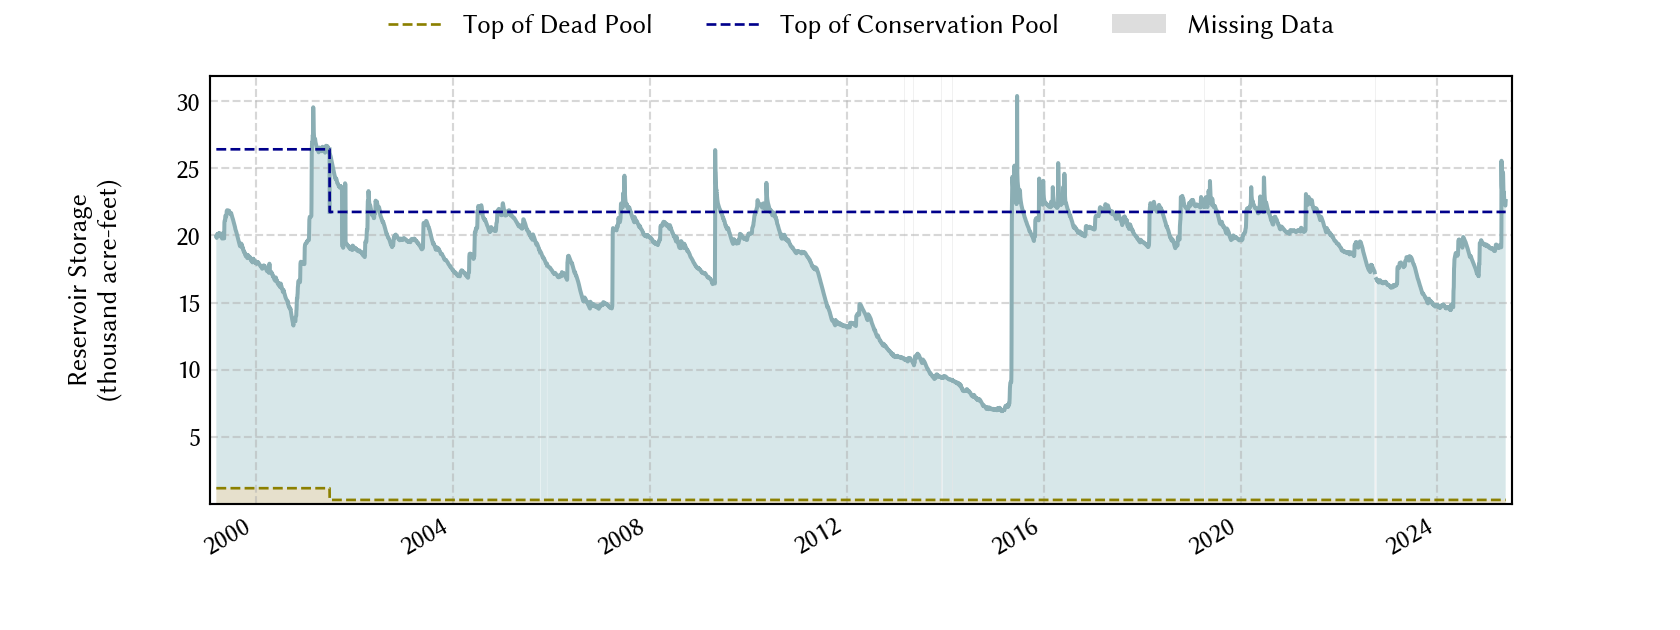
| Impoundment date | 1960-01-01 |
| Vertical datum | NGVD29 |
|
Dead pool elevation |
795.00 ft above NGVD29 |
|
Dead pool elevation |
795.00 ft above NGVD29 |
| Service spillway crest elevation | 827.50 ft above NGVD29 |
| Emergency spillway crest elevation | 835.00 ft above NGVD29 |
| Top of dam elevation | 847.00 ft above NGVD29 |
|
Conservation pool elevation |
827.50 ft above NGVD29 |
|
Conservation pool elevation |
827.00 ft above NGVD29 |
| Data download (CSV) | period of record, last one year, last 30 days |
| Data Source | USGS:07315600 |
| USGS Monitoring Location | USGS:07315600 |
Lake Location
