Lake Worth: 74.9% full as of 2026-08-02
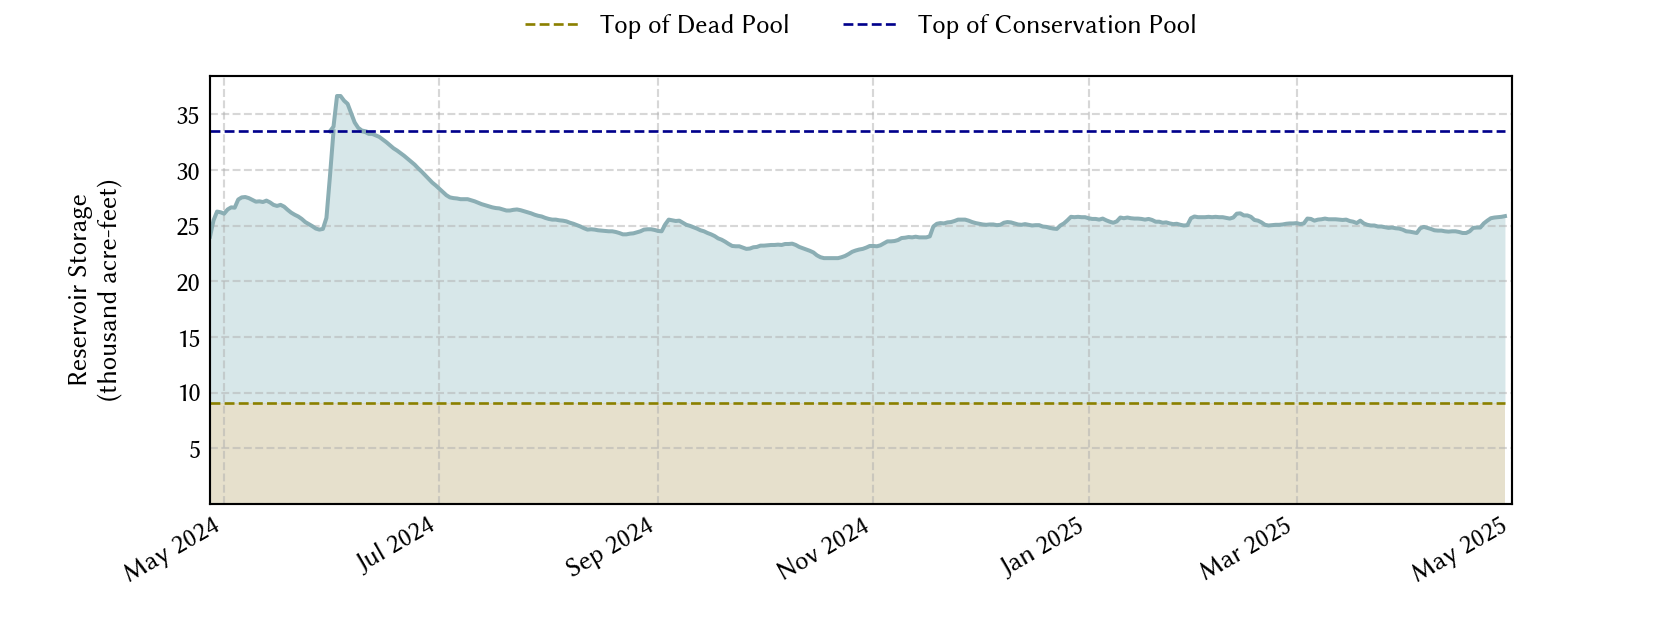
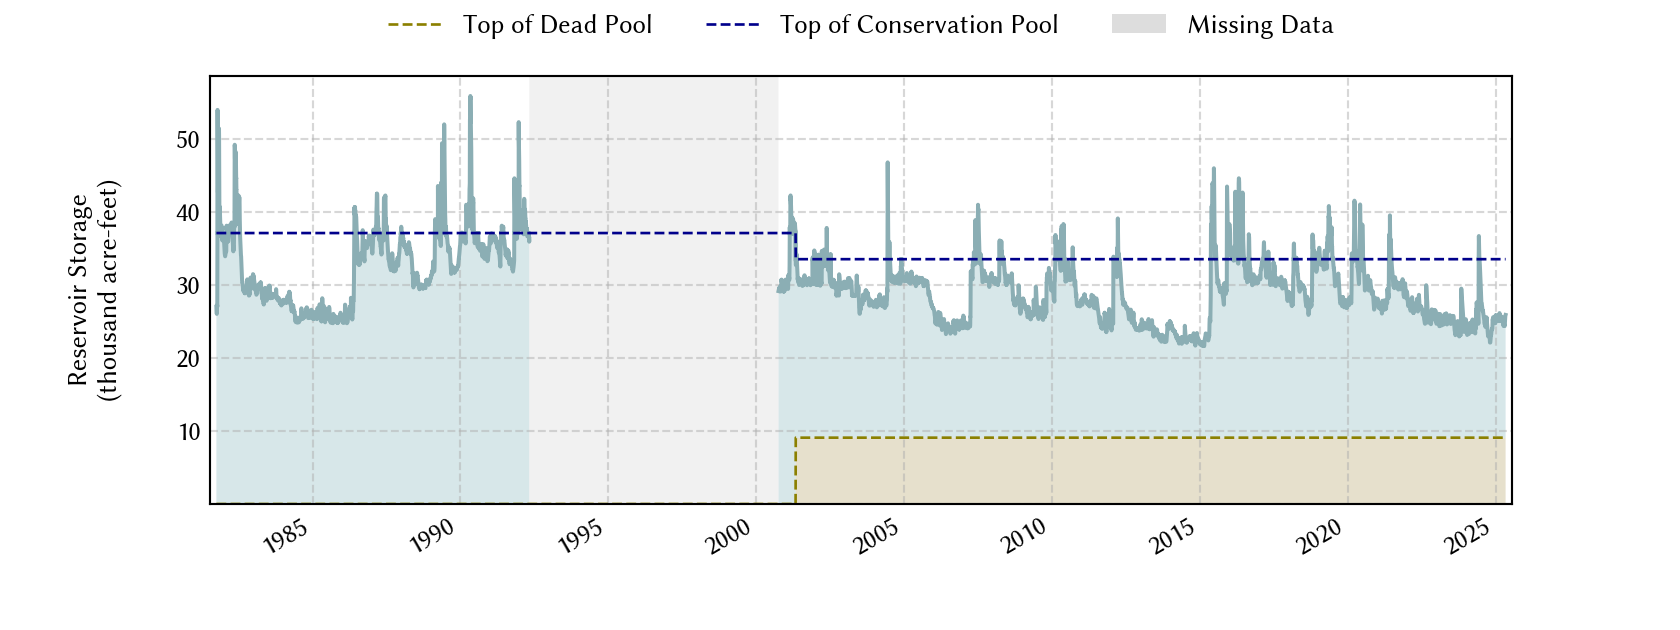
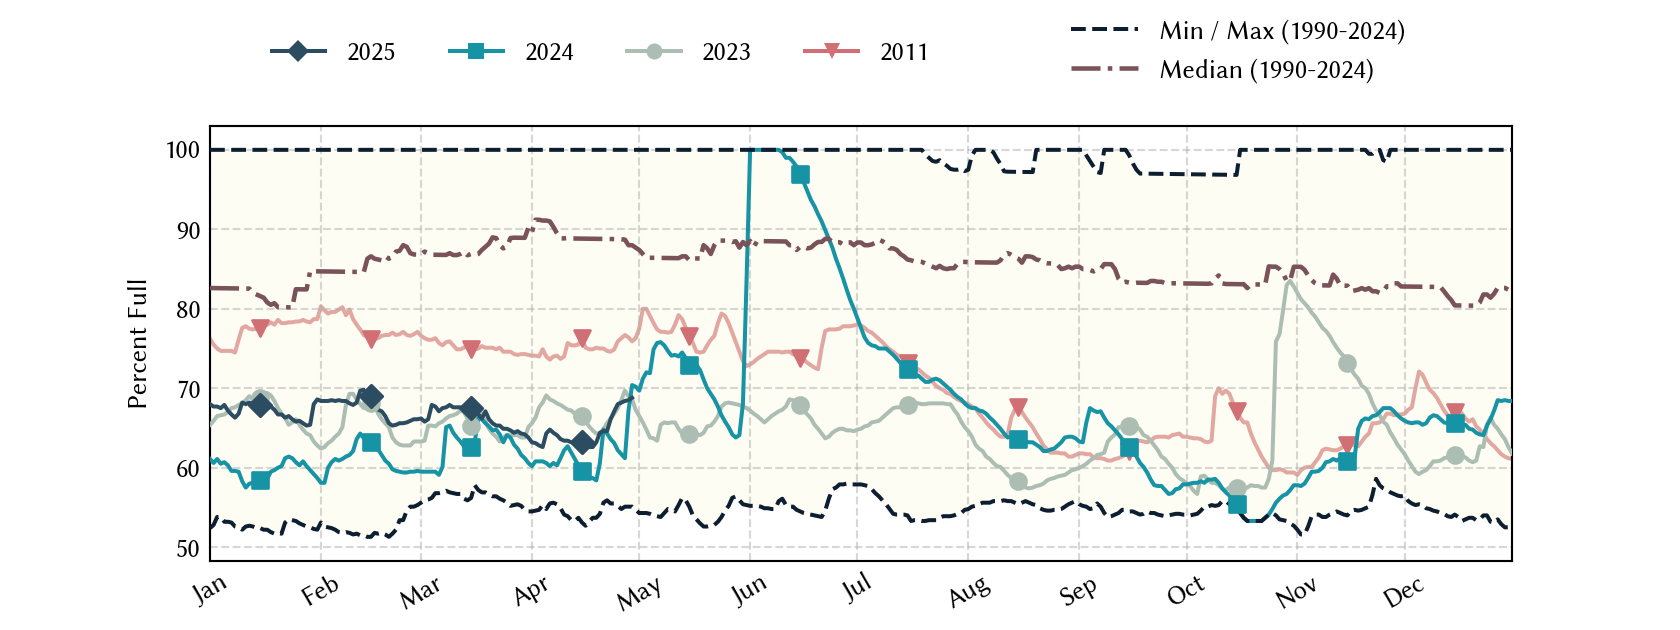
Historical Data
| Date | Percent Full |
Mean Water Level (ft) |
Reservoir Storage (acre-ft) |
Conservation Storage (acre-ft) |
Conservation Capacity (acre-ft) |
Surface Area (acres) |
|
|---|---|---|---|---|---|---|---|
| Today | 2026-08-02 | 74.9 | 592.15 | 27,358 | 18,282 | 24,419 | 3,205 |
| Yesterday | 2026-08-01 | 75.8 | 592.22 | 27,583 | 18,507 | 24,419 | 3,214 |
| 2 days ago | 2026-07-31 | 76.4 | 592.27 | 27,744 | 18,668 | 24,419 | 3,221 |
| 1 week ago | 2026-07-26 | 77.9 | 592.38 | 28,099 | 19,023 | 24,419 | 3,234 |
| 1 month ago | 2026-07-02 | 71.5 | 591.89 | 26,529 | 17,453 | 24,419 | 3,171 |
| 3 months ago | 2026-05-02 | 79.1 | 592.47 | 28,390 | 19,314 | 24,419 | 3,245 |
| 6 months ago | 2026-02-02 | 75.9 | 592.23 | 27,615 | 18,539 | 24,419 | 3,216 |
| 1 year ago | 2025-08-02 | 85.3 | 592.93 | 29,896 | 20,820 | 24,419 | 3,301 |
*
Percent Full is based on Conservation Storage and Conservation Capacity and doesn't account for storage in flood pool.
**
Values above, including today's are averaged conditions. For near real-time instantaneous water level, see table below or the interactive map viewer.
Most Recent Instantaneous Water Level
| Date/time |
Water Level (ft) |
Conservation Pool Elevation (ft) |
Height Above Conservation Pool (ft) |
|
|---|---|---|---|---|
| Most recent | 2026-08-02 16:00 | 592.29 | 594.00 | -1.71 |
| 1 hour prior | 2026-08-02 15:00 | 592.29 | 594.00 | -1.71 |
| 2 hours prior | 2026-08-02 14:00 | 592.28 | 594.00 | -1.72 |
| 6 hours prior | 2026-08-02 10:00 | 592.18 | 594.00 | -1.82 |
| 12 hours prior | 2026-08-02 04:00 | 592.14 | 594.00 | -1.86 |
| 24 hours prior | 2026-08-01 16:00 | 592.15 | 594.00 | -1.85 |
| 48 hours prior | 2026-07-31 16:00 | 592.27 | 594.00 | -1.73 |
*
Data is provisional and subject to revision.
Additional Information
| Impoundment date | 1914-01-01 |
| Vertical datum | NGVD29 |
| Dead pool elevation | 584.30 ft above NGVD29 |
| Service spillway crest elevation | 594.30 ft above NGVD29 |
| Top of dam elevation | 609.50 ft above NGVD29 |
|
Conservation pool elevation |
594.00 ft above NGVD29 |
|
Conservation pool elevation |
594.30 ft above NGVD29 |
| Data download (CSV) | period of record, last one year, last 30 days |
| Data Source | USGS:08045400 |
| USGS Monitoring Location | USGS:08045400 |
Lake Location