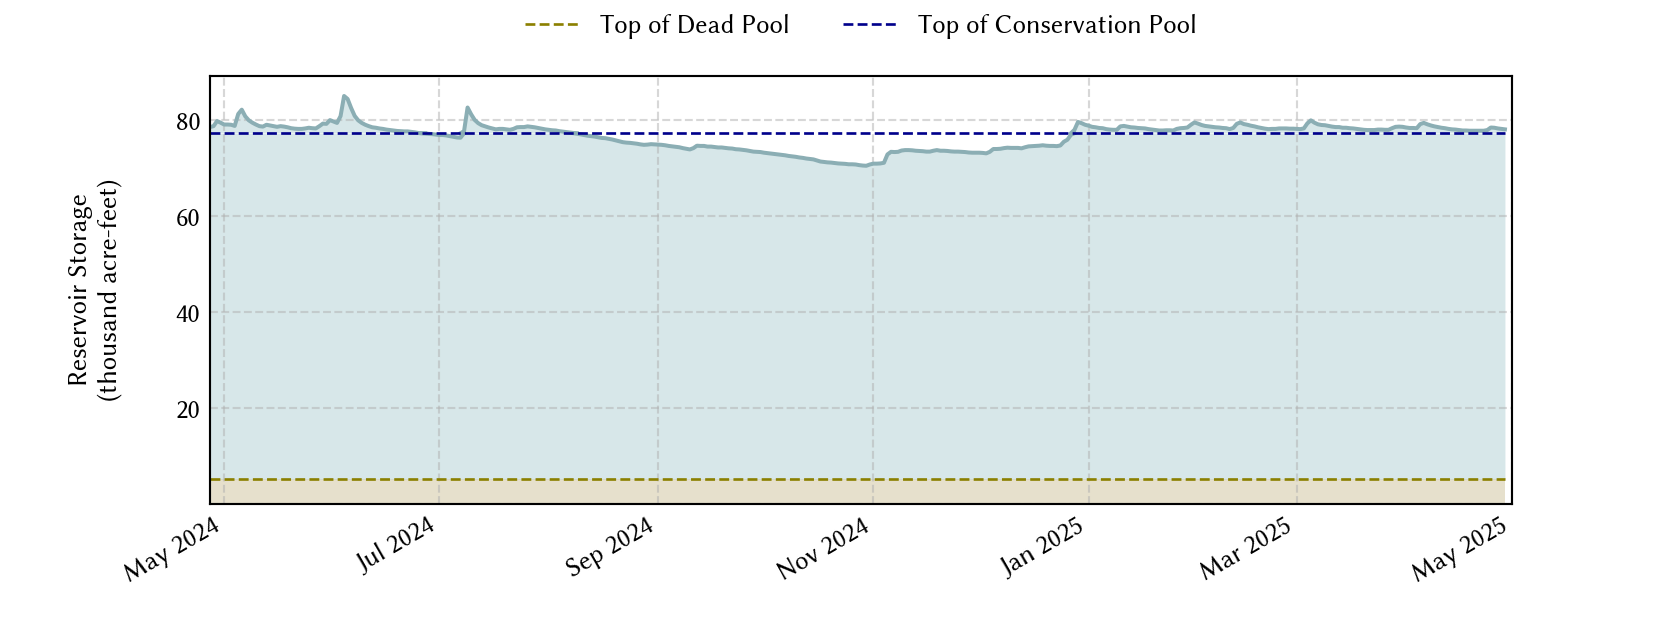
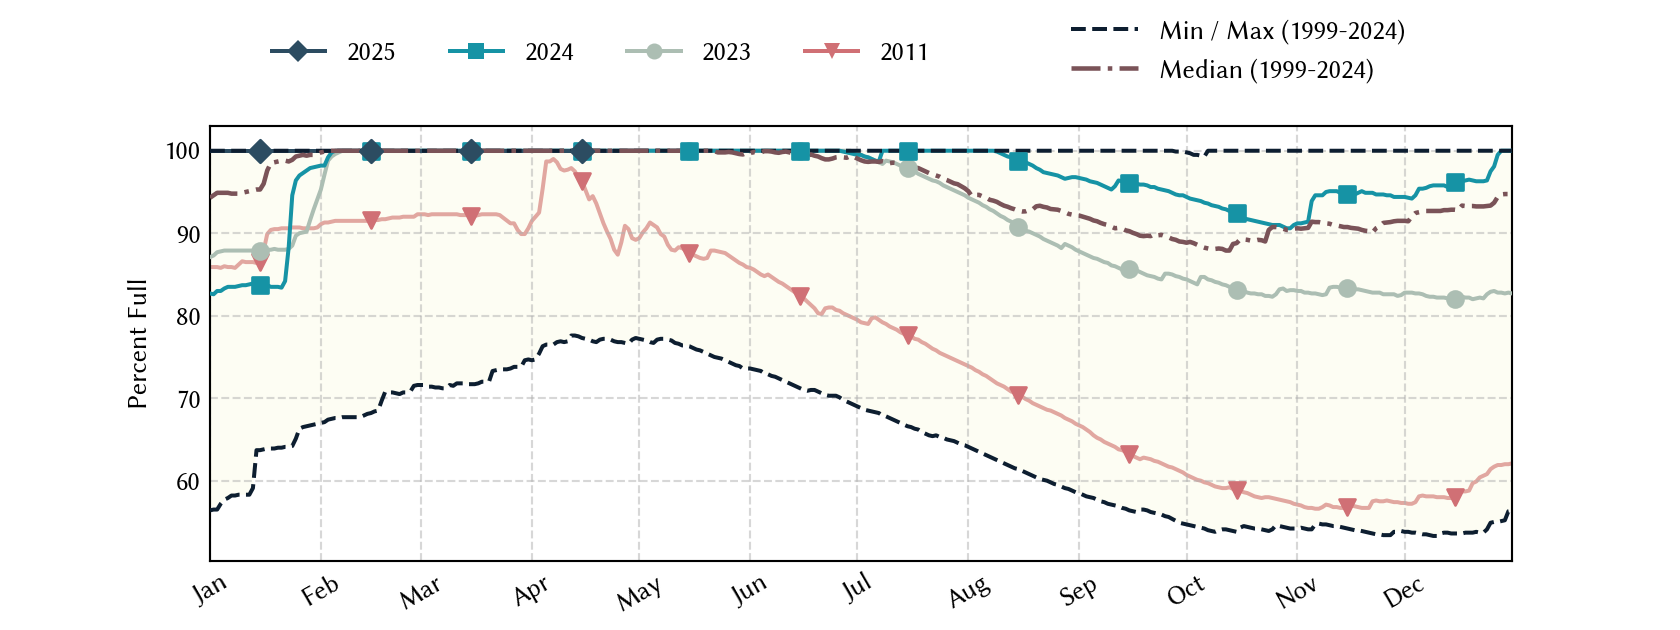
Lake Tyler: 96.5% full as of 2026-07-31
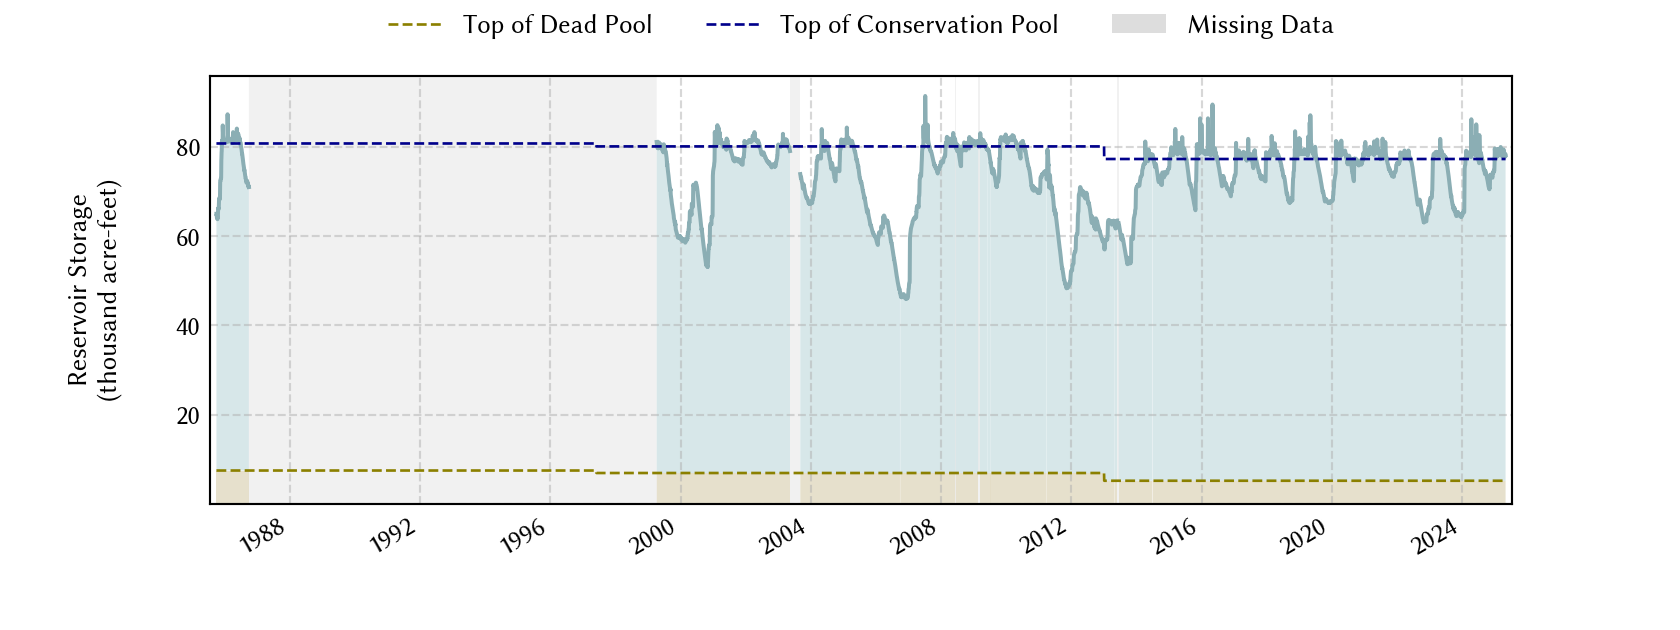
Historical Data
| Date | Percent Full |
Mean Water Level (ft) |
Reservoir Storage (acre-ft) |
Conservation Storage (acre-ft) |
Conservation Capacity (acre-ft) |
Surface Area (acres) |
|
|---|---|---|---|---|---|---|---|
| Today | 2026-07-31 | 96.5 | 374.84 | 74,771 | 69,560 | 72,073 | 4,593 |
| Yesterday | 2026-07-30 | 96.8 | 374.88 | 74,955 | 69,744 | 72,073 | 4,601 |
| 2 days ago | 2026-07-29 | 96.9 | 374.90 | 75,047 | 69,836 | 72,073 | 4,606 |
| 1 week ago | 2026-07-24 | 97.9 | 375.06 | 75,787 | 70,576 | 72,073 | 4,640 |
| 1 month ago | 2026-06-30 | 96.3 | 374.80 | 74,588 | 69,377 | 72,073 | 4,584 |
| 3 months ago | 2026-04-30 | 98.7 | 375.18 | 76,345 | 71,134 | 72,073 | 4,667 |
| 6 months ago | 2026-01-31 | 93.7 | 374.39 | 72,726 | 67,515 | 72,073 | 4,501 |
| 1 year ago | 2025-07-31 | 99.0 | 375.23 | 76,579 | 71,368 | 72,073 | 4,679 |
*
Percent Full is based on Conservation Storage and Conservation Capacity and doesn't account for storage in flood pool.
**
Values above, including today's are averaged conditions. For near real-time instantaneous water level, see table below or the interactive map viewer.
Most Recent Instantaneous Water Level
| Date/time |
Water Level (ft) |
Conservation Pool Elevation (ft) |
Height Above Conservation Pool (ft) |
|
|---|---|---|---|---|
| Most recent | 2026-07-31 19:30 | 374.83 | 375.38 | -0.55 |
| 1 hour prior | 2026-07-31 18:30 | 374.81 | 375.38 | -0.57 |
| 2 hours prior | 2026-07-31 17:30 | 374.82 | 375.38 | -0.56 |
| 6 hours prior | 2026-07-31 13:30 | 374.82 | 375.38 | -0.56 |
| 12 hours prior | 2026-07-31 07:30 | 374.83 | 375.38 | -0.55 |
| 24 hours prior | 2026-07-30 19:30 | 374.88 | 375.38 | -0.50 |
| 48 hours prior | 2026-07-29 19:30 | 374.89 | 375.38 | -0.49 |
*
Data is provisional and subject to revision.
Additional Information
| Impoundment date | 1967-01-01 |
| Vertical datum | NGVD29 |
| Dead pool elevation | 350.00 ft above NGVD29 |
| Service spillway crest elevation | 375.38 ft above NGVD29 |
| Top of dam elevation | 390.00 ft above NGVD29 |
| Conservation pool elevation | 375.38 ft above NGVD29 |
| Data download (CSV) | period of record, last one year, last 30 days |
Elevation-Area-Capacity Curves
1967-01-01 (source: USGS)
1997-06-01 (source: TWDB)
: GIS Data
2013-01-01 (source: TWDB)
: GIS Data
|
|
| Data Source | USGS:08034000 |
| USGS Monitoring Location | USGS:08034000 |
Lake Location